Few business owners would argue that 2008 was a challenging year. Gas prices soared, stock values tanked, credit dried up, and inventory and shipping costs skyrocketed.
It’s not all bad news, thankfully. Market reports indicate that though some numbers are down, our industry has bucked the trend of widespread and significant sales loss. In fact, even in the hardest of economic times, it seems that consumers recognize the need for good nutrition and are opening their wallets for organic foods, dietary supplements and natural personal care items. Data from this year’s WholeFoods survey confirm stores are seeing greater foot traffic than they did in years past and are selling more in each transaction. Overall, 70% of all businesses said their sales grew this past year; of these, respondents said numbers were up by nearly 10%. Last year, only 52% of retailers felt this way. Overall, WholeFoods estimates a 3.7% sales increase among all independent stores, indicating a tailing off of growth. Clearly, the industry is still growing, but there is some downward pressure on growth given the economic climate.
Before proceeding with the numbers, it’s important to note that this year’s survey has been improved. We aimed not only to collect hard data on retailers’ sales and business improvements, but also to give stores the chance to speak to us about what’s working for them, what’s not and why. The result, we hope, will be a tool through which we can all gauge the health of our industry and learn from each other about how to tweak our businesses for the better.
A special thanks to all the retailers who participated in this year’s survey and to Jay Jacobowitz, president and founder of Retail Insights and merchandising columnist for WholeFoods Magazine, who helped us rework this year’s questionnaire. His expertise and insight were invaluable.
 Mix It Up
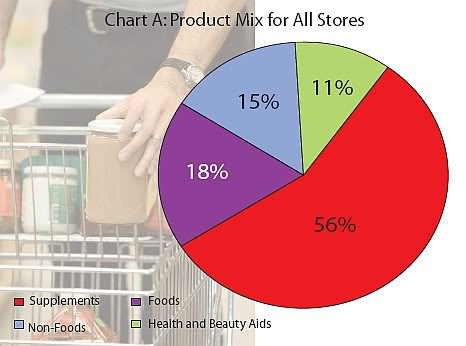
Product Mix Versus Sales. What is the ideal product mix to maximize profit? There’s no easy answer, but variety and convenience seem to be major parts, according to this year’s WholeFoods survey. When asked to estimate their stores’ product mix, retailers said the majority of their sales come from supplements and vitamins (56%). Foods—both refrigerated and non-refrigerated—take second place (18%), followed by non-foods (15%) and health and beauty aids (11%) (see Chart A).
Overall, 80% of all stores said they offer perishable foods (which included frozen, refrigerated, produce, prepared, bakery, deli, grab-and-go and other similar product types). Respondents who offer such items say about 15% of all their sales come from these products.
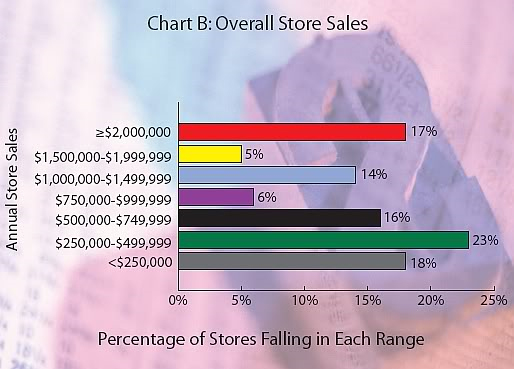
Let’s digress momentarily to note the respondents’ sales for this year, which averaged about $1,045,258 per store (see Chart B).
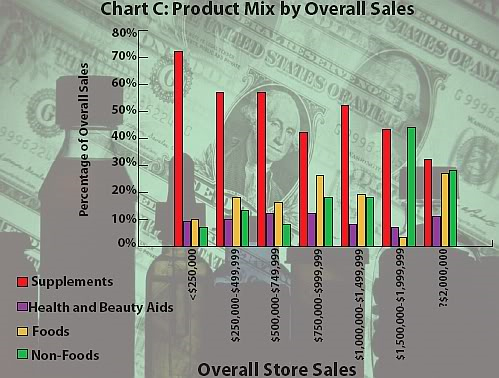
Comparing individual store sales against their product make-up generated some interesting results, as stores with sales in the highest ranges had a very different product mix than stores in the lowest ranges (see Chart C). Stores on the lowest end (<$250,000) tend to rely heavily on supplement/vitamin sales (73% of sales), whereas businesses with the highest sales (≥$2,000,000) spread out their mix more evenly. The highest-revenue stores averaged 33% from supplements, 12% from health and beauty aids, 27% from refrigerated/non-refrigerated foods and 28% from non-foods and other items. As will be discussed a little later, the choice to divide store offerings in this manner may be related to store location and other factors.
Not surprisingly, stores with lowest sales also had the smallest footprints, with an average of 840 ft2. Contrast this figure with that of stores that lead in sales: 6,195 ft2. Again, large store size and high overall sales were linked with small supplements sections. The average of all stores was $406 per ft2, but stores doing near-average or above-average sales ($400–650/ft2 and >$650/ft2) had the smallest supplements sections of all (46% and 44% of the total product mix, respectively).
This breakout of sales data against product mix isn’t intended to say that businesses that rely heavily on dietary supplements sales aren’t doing well. Quite the contrary, stores with sales of less than $250,000 and those with sales of $250,000–$499,999 held their own with respect to how much money customers spend at the register. They averaged $40 and $42 per transaction, respectively, most likely because a basket of supplements often costs more than a basket of food items. Shops in the highest sales bracket (more than $2,000,000) averaged $33 per transaction, respectively.
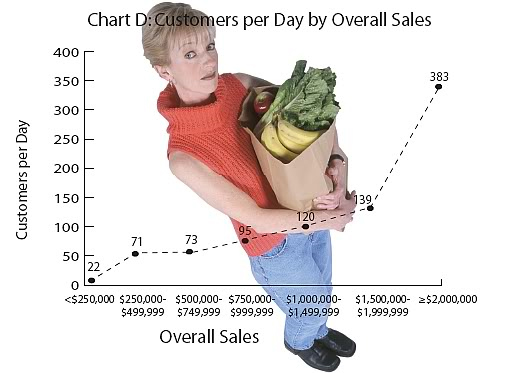
This also says something about store environment. Businesses with the smallest overall sales seem to rely heavily on a small, reliable customer base (an average of 22 shoppers per day for stores that make less than $250,000 each year) that regularly comes back to their store on a regular 30-day cycle. Chances are, these owners know their customers well (maybe many by name) and can offer more individual attention and are proactively guiding shoppers in their choices. Of note, the amount of shoppers that owners reported having each day was correlated with store sales. The more the customers, the greater the overall sales (see Chart D).
Location, Location, Location. Before leaving this topic of sales/product mix/foot traffic, it is necessary to factor in store location. Shops with the smallest food sections were found in metropolitan areas and large cities, where these items make up just 13% and 9% of total product mix. In contrast, stores in medium cities, small cities and large towns/rural areas tended to dedicate much more space to food items (19%, 21%, 21%, respectively).
Clearly, this is reflective that high rents in metropolitan areas prohibit a store’s ability to offer items that require more shelf space such as food products. Square footage tended to grow as population density became sparser. Though rent averaged $2,841 per month for 3,354 ft2 among all stores, those in metropolitan areas (with populations over one million) tend to pay much more for far less: about $4,079 every month for store sizes of about 2,415 ft2. Compare this with storeowners in medium cities, who pay just a hair more each month ($310 more per month) than metropolitan owners for an extra 1,152 ft2. The tradeoff, of course, is the opportunity for more clients among larger populations. Stores in metropolitan areas averaged far more customers each day (256 shoppers) than stores located in small cities (140 shoppers) and rural towns (97 shoppers).
|
The Word-of-Mouth Factor When asked to describe their most effective marketing strategy last year, many respondents noted “word of mouth.” How does this form of promotion stack up against higher tech options like television, radio or Web ads as a smart strategy? Very well, says Jay Jacobowitz, president and founder of Retail Insights and merchandising columnist for WholeFoods Magazine. |
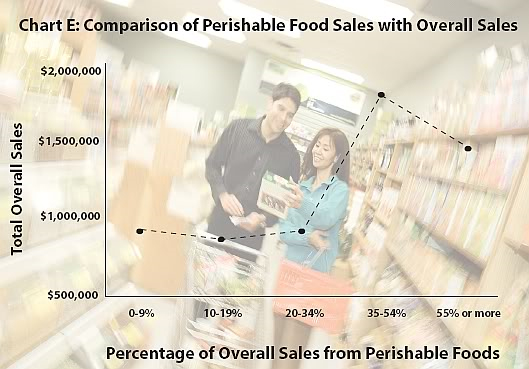
The Lessons Learned? Variety and size may generate sales, but small, supplements-focused stores have a reliable customer base that keeps coming back for more. This is especially the case in areas with large populations. And, the more foods you add to a store, the better the sales. In fact, stores with the largest percentage of sales from perishable foods (30–54% and more than 55%) had greater sales ($2,000,000 and $1,687,500 overall, respectively) than stores with the smallest perishable sales (about $1,000,000 overall, or less.) (see Chart E).
Let’s dig deeper into how stores with the most shoppers spend their marketing and advertising budget, as these techniques are key to generating new business and retaining old clients.
Reeling ‘Em In
Respondents to this year’s survey averaged 116 customers per day, with sales of about $40.40 per transaction. Though sales by transaction are down marginally from 2007 (by $2.44), the amount of customers visiting the stores each day is up by a whopping 61% (73 in 2007 versus 116 this year).
So, what are the stores with the most foot traffic doing to reel in customers? Marketing and promotions data were analyzed according to store foot traffic (divided into groups of ≤49 customers/day, 50–99 customers/day and ≥100 customers/day). Interestingly, it may not be the marketing budget, but rather how the dollars are split up that most affects traffic. In fact, stores with the fewest customers per day (≤49) and those with the most (≥100) averaged nearly the same spending on advertising and marketing: $1,536.07 versus $1,538.06 per month, respectively.
All survey takers were asked to describe which promotional methods they engaged in this past year. The top three techniques across all foot traffic ranges were educational handouts, in-store sampling and regular discounts. Of note, in-store sampling was the most popular pick among stores with the most customers per day (50–99 and ≥100). This is a smart choice, according to data recently released from a product sampling study conducted by the research firm Arbitron, New York, NY. Results from 1,857 telephone interviews conducted in early 2008 suggest “more than one-third of consumers who try a sample buy the sampled product during the same shopping trip” and “more than half of people who sample a product plan to buy it in the future.” The outlook is especially good for sampling of items that are new to the market, as the firm notes that 25% of consumers who have never heard of the product bought the item immediately after trying it.
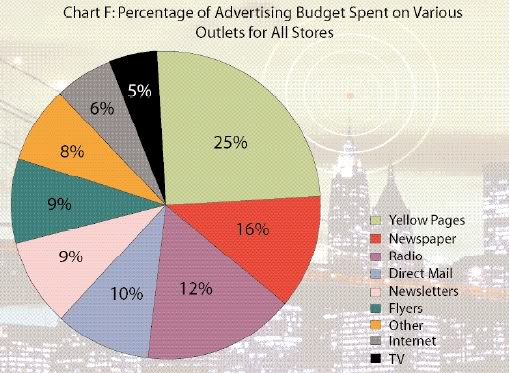
On the advertising front, the favorite means of promotions/marketing spending varied somewhat among stores. Stores with all ranges of customer foot traffic favor advertising in the Yellow Pages, with 25% of all advertising expenditures delegated here (see Chart F). This form was the favorite last year, too, grabbing 19% of all advertising budgets in 2007.
Interestingly, the percentages noted in Chart F varied according to store traffic. Shops with the fewest shoppers per day spent the second largest chunk of their advertising budget on direct mail (16%). Stores with 50–99 clients and 100 or more customers per day spent almost none of their ad dollars in this manner (4% each). Conversely, stores drawing 100 or more people every day spent 17% of their advertising budget on radio ads. The other stores spent only about 8% on this form of promotion. One other noteworthy difference: stores with less than 99 customers per day favored flyers much more than stores with the highest traffic. Respondents with the most customers placed this form of advertising in their bottom three choices.
While it’s tempting to attribute this trend to a bigger advertising dollar pool, stores with customer traffic at both ends of the spectrum spent nearly the same on promotions this past year. The difference may be partly regional, as stores in metropolitan areas spent less of their budget on radio ads (about 11%) than stores in any other region. Of course, radio time may be most expensive in metropolitan areas. Nonetheless, stores in large cities did prioritize radio ads, with a large portion of their budget allocated here (19%). Clearly, there are good opportunities for this type of advertising in secondary markets where you can reach a good amount of people for a reasonable amount of money.
All respondents were asked to describe their most-effective marketing strategy over the past year. For stores looking for some inspiration, here are some ideas to chew on:
- Customer newsletters were thought to bring in extra sales, especially those that were personalized for the store or developed by the owner. One respondent noted, “I write and send out a newsletter (with sales roster/direct mail) and customers love it.”
- If you’re feeling some competition from a local Farmers’ Market, step foot on their turf and rent some space of your own to display your products…especially locally grown, handmade or private labeled products.
- Make a take-out menu for your store’s café or prepared foods section and distribute it in the community.
- Take out an ad in your community calendar.
- Link celebrations with sales such as an Earth Day celebration sale, a store anniversary discount, etc.
- Get students to check out your offerings and offer them a special discount. If you’re located in a college town, try advertising on the college ad board.
- If you have a satisfaction guarantee, make it known and be clear about the parameters. Many clients may be enticed to try something new if they know they won’t be strapped with a product they don’t like. One store reported having a double money-back guarantee.
- Offer special discounts to senior citizens, those in financial need and good grades for students.
- Run a loyalty card program.
- Consumers are always looking for something new and different, so consider having a promotion of the month for variety.
Private Labeling Do’s and Don’ts
Offering clientele a selection of foods, supplements, beauty care and other products under a store’s own private label brand is often recommended as a way to boost sales, serve as free store advertising, increase foot traffic and strengthen the bond between the shopper and the store.
This year, businesses responding to the WholeFoods survey offered an average of eight private products in their store. When crossing these data with the storeowners’ years of experience, we found that 75% of new owners (in business less than five years) don’t offer a private label brand at all (see Table 1). Though there were spikes in the trend, the percentage of storeowners who offer private label items increased with years of ownership, as did overall store sales.
|
Table 1: Store Trends by Years of Experience |
||||||
|
Product Mix |
||||||
|
Years of Ownership |
Offers Private Label Brand |
Overall Sales Average |
Supplements | Beauty | Foods | Non-Foods |
|
0-5 |
25% |
$588,235 |
58% |
13% |
16% |
13% |
|
6-11 |
46% |
$828,260 |
65% |
13% |
13% |
10% |
|
11-20 |
54% |
$1,012,121 |
57% |
10% |
17% |
17% |
|
20+ |
50% |
$1,376,744 |
49% |
10% |
24% |
17% |
Going about starting a store brand can be confusing and daunting for those new to a business. Storeowners may not be sure about whether carrying a private label line is worth the time and resources. Says Paul Licata of World Organic and Licata Enterprises, “Selling a private label supplement line is a decision that must be made by any store owner. The owner must decide that it is in their best interest to invest in themselves as the private label supplier also invests in the store.”
WholeFoods Magazine asked two private label specialists, World Organic/Licata Enterprises and Vitamer Labs, for some tips for new owners to think about when making the decision to stock a store brand. Here’s what they had to say.
- Decide who is the customer for your private label brand. General health or natural food stores may want to focus on a basic supplement line and then expand, says Licata. Some stores even have multiple private label brands like a regular and a premium brand.
- If you’re worried about high minimums for private label stock, Licata says some companies offset this by offering higher gross margins. For example, he notes, “our prices are approximately 20% to 25% below national brand prices. This allows the retailer to either sell their private label brand at a lower price or make a higher profit . . . or somewhere in between. The nice thing is . . . the pricing is their choice!”
- Take advantage of the private label manufacturer’s sales reps. “Have them give their staff a complete training on the company, their mission and vision, the products and how to sell them. As manufacturers, we have excellent information on current regulatory status and clinical data—use us!,” says Erin Silva, MS, RD, CNSD, Vitamer’s technical marketing manager.
- Shop around for deals on printing labels. “Each private label supplier has their own format for printing labels from requiring the store to provide or pay for the labels, pay a fee, or in our case, we do not charge for printing private labels,” says Licata. Check label reorder minimums, too.
Some private labeling companies offer an in-house graphic team that handles label designs. “We offer suggestions for variable pricing to help the store be competitive with other products in their store and region. Premium private label can be set just lower than its competing brand, but not too low,” says Silva. “Your goal is to have more of your name in your customer’s home so price and merchandise it accordingly.” - Offering private labels may enable you to consolidate your inventory. Says Licata, “Many products ideal for private label are the best sellers such as vitamin C 1,000 mg, vitamin E 400 IU, one or two multiple vitamins and the like.” Since many consumers, he says, don’t really care which Vitamin C 1,000 mg they buy, “there is no real reason for most stores to carry six or seven brands. Sell your private label and your best-selling one to three national brands.” Expand your private label line once your customers realize its quality.
- Less is not more, with private label. According to Licata, stores often make the mistake of offering too few private label items. “Usually we feel that about 20 products is a good minimum for a health food store to start a private label. This number can provide the basic sellers, while allowing the store room to grow in specialties and broadening the line,” says Licata.
Silva suggests bringing in “as full of a set as space allows—at least as much as you would for a full line national brand. If a retailer wants to carry the basics, they should set this line of basics in their own brand, and save inventory dollars and space for the unique items of national brands.”
ONLINE EXCLUSIVE: According to Licata, the following 20 items are must-have items for a basic private label supplements line:
Beta Carotene 25,000 IU softgel
Sublingual B-12 1000 mcg with Folic Acid
Niacin 500 mg
B Complex 50 Tablets
B Complex 100 Tablets
B Complex 100 Capsules
Vitamin C 1000 mg Time Release
Vitamin C Complex with Bioflavanoids
Vitamin E 400 IU mixed tocopherols
Vitamin E 1000 IU mixed tocopherols
Lecithin 1200 mg softgel
Omega-3 1000 mg Fish Oils
Evening Primrose Oil 500 mg
Multiple Digestive Aid
Multiple Vitamin medium potency
High-Potency multiple vitamin
Multiple Mineral
Calcium-Magnesium or Calcium-Magnesium Zinc tablet
Potassium 99 mg
Zinc 50 mg
|
How Much Are You Worth? Many in our industry made the choice to become a natural products retailer with their hearts, not their wallets. A good portion of respondents to this year’s WholeFoods Retailer Survey seems to view their stores as more of a lifestyle or a hobby than a for-profit business. One storeowner puts it in perspective: “Fortunately, doing retail is assurance that you will go to heaven.” In fact, 34% said they don’t pay themselves a salary. If they did not pay themselves, storeowners said they would need to pay about $57,811 to hire another worker to take care of their duties. Stores that had the smallest sales (<$250,000) would pay the least ($29,740) to hire a manager, whereas stores selling $1,500,000–$1,999,999 worth of product every year said they would spend $113,000. Overall, storeowners pay $10,678.61 per week on average for salaries and wages for direct store labor. |
Spread Your Wings
A portion of all respondents (19%) own more than one location. Such survey takers say their businesses have anywhere from two to 140 stores, and 64% fell in the 1,000–2,599-ft2 range.
Will we see more stores open up second locations next year? When all respondents were asked about their growth plans for next year, 12% indicated that they were planning to add retail space (slightly less than last year’s percentage of 15%). Of note, such expansions will be fairly significant as these owners are planning to add an average of 2,739 ft2 to their existing stores. Many of these respondents report that this space is intended for food-related products such as a wheat-free/gluten-free section, a smoothie bar, a luncheon or a frozen foods area.
About 3% of survey takers say they added at least one store last year, but 15% plan to do so next year. The average footprint of these new stores will be a good size: 3,713 ft2.
Nearly one in five storeowners (19%) remodeled their businesses last year, spending an average of $52,771.49 on their stores (about $1,700 more than last year).
2009 Predictions
A large majority of storeowners expect next year to outshine this year in terms of sales. The majority (87%) believe their sales will increase over the next 12 months. These individuals are hoping to see 9% gains in sales. On the flip side, about 13% of respondents anticipate that sales will drop next year (by an average of 8%).
Competition was on the minds of many survey takers. They named the following when asked to predict their competition for next year: web-based stores, large chain industry stores (like Whole Foods Market and GNC), drug stores and mass market supermarkets. Some even are feeling the crunch from new independents that have come to town.
But overall, retailers would be best served to keep focused on smart planning for their stores’ futures, exploring the competition and enticing new (and return) customers to come your doors by playing up your strengths. One survey respondent put it best: “Let the competitors worry about me. I don’t worry about them.” He’s right. Independent stores have much to offer and many are poised to grab a bigger piece of the consumer pie in 2009. WF
Published WholeFoods Magazine, December 2008