
While some retail sectors are making the best of stagnant or declining sales, the natural/organic industry is a standout. Natural and organic products retailers hold a unique place in the lives of consumers. Even if shoppers have less financial security than they did in years past, there’s no lack of enthusiasm and loyalty when it comes to the natural and organic products they depend on to lead healthy lives.
These trends are evident in the 2012 WholeFoods Magazine Retailer Survey, now in its 35th year. Many stores reported robust sales, even more than the previous year. There’s steady foot traffic, and savvy retailers are finding innovative ways to engage both new and returning customers.
The 2012 Survey
The 2012 WholeFoods Retailer Survey, covering July 1, 2011 through June 30, 2012, was our largest ever. We compiled data from independent natural products retailers nationwide, with just under half of our data reported from the West (47%) and 24% from the East. The remaining stores were spread throughout the South (19%), Midwest (7%) and the Rocky Mountains (3%). Store locations were distributed fairly evenly among various market areas from major metropolitan locations to large towns.
We can also consider 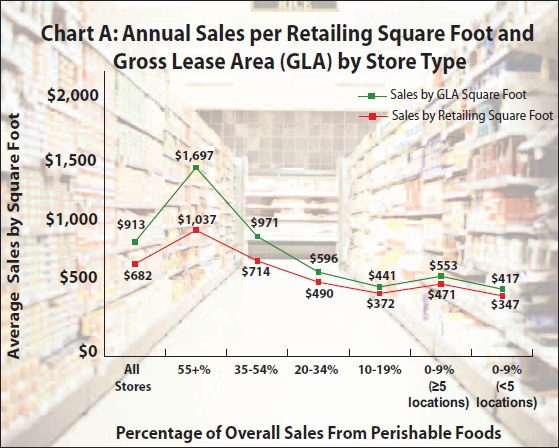 ownership and business age; establishments’ average age was 21 years, 17 of which were under the current owner. While a slightly younger crowd than last year (which averaged 25 years in business and 19 years under the current owner), 2012’s stores are clearly well established and a contributing factor in this year’s robust sales numbers.
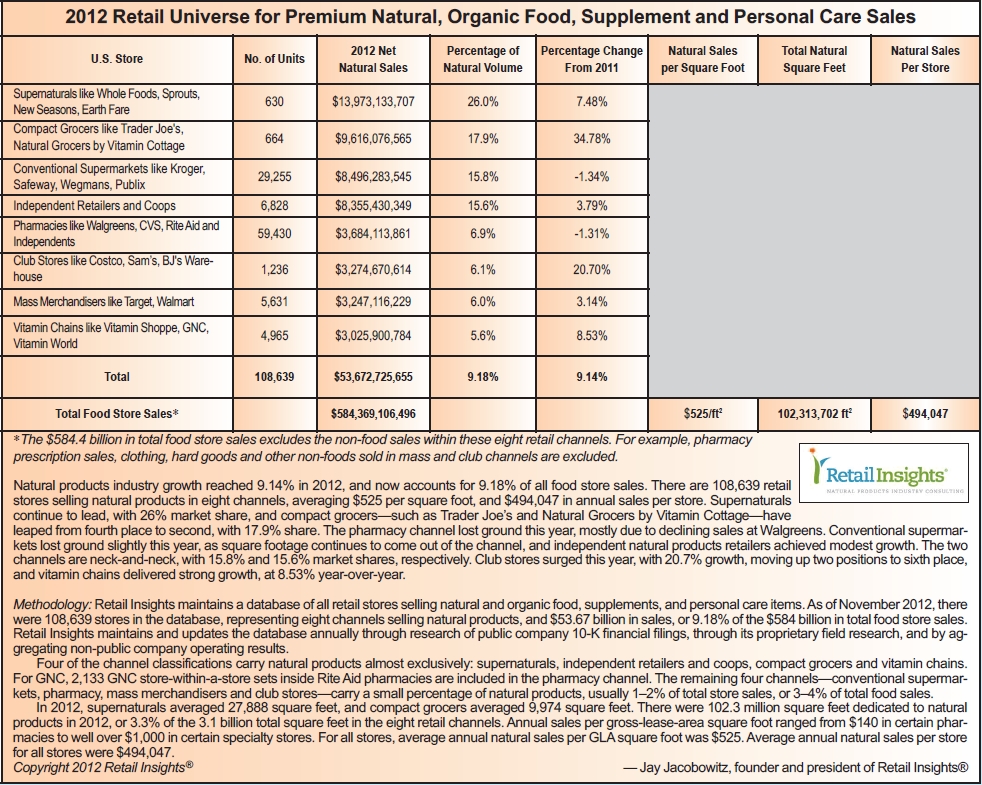
Combined, 2012 respondents comprise nearly one million total square feet of lease area and $665 million in sales—more than we’ve ever tracked before. Note that the survey was only sent to non-public, independent retailers, so the responses do not include any public companies like Whole Foods Market, Sprouts, Vitamin Shoppe, GNC and the like. For a complete picture of the 2012 Retail Universe (supplied by Retail Insights), including these stores, see the sidebar at the end of this article.
A variety of stores participated this year, from smaller supplements-focused businesses to larger natural grocers that feature fresh and other perishable foods. Several respondents were from multi-store businesses, including those with more than five locations under their umbrellas.
Given this diversity, we again organized our analysis according to which departments each store focuses on most. The category that most clearly sets apart a store is perishables, which we define as refrigerated and frozen foods, produce and prepared foods. More than any other, this variable is most likely to determine a store’s square footage, the number of transactions it rings daily and its gross sales. At the other end of the spectrum, a store with supplements as its core business has many tools at its disposal to achieve strong sales per square foot by relying on smart vendor negotiation, excellent customer service and just the right product mix.
 Thus, the following tables and analysis will present store results through the lens of department focus. We believe this is the easiest and most reliable way to take a clear snapshot of the inner workings of natural products retailing, and the best way for you to apply the results to your business.
So, natural products retailers, please take a moment to estimate the percentage of your annual gross sales that comes from perishables departments. From there, locate the percentage range in our survey tables and charts that includes your store’s perishables sales percentage. These statistics will give you the most relevant comparisons to your unique situation, and we hope they will be helpful tools for making positive change in your own business.
When considered as a whole, we believe the survey presents a comprehensive and accurate reading of 2012’s natural products retailing activity from which the entire industry can benefit.
A special thank you to all the retailers who took the time to participate in this year’s survey, and congratulations to Cranberry’s Grocery and Eatery of Staunton, VA, the winner of our $100 cash prize. We are also grateful for the help of Jay Jacobowitz, president and founder of Retail Insights and WholeFoods Magazine’s merchandising editor, in analyzing this year’s survey data.
The Big and Small of It
As in years past, 2012 respondents were primarily from brick and mortar stores, and about 30% earned at least some of their sales online (though many only report a small fraction of sales from this source). This is on par with 2011 stores, about 27% of which took in some online sales.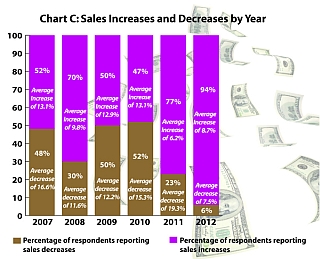
As for their physical locations, the overall average gross lease area (GLA) for all stores was 5,300 ft2, of which 3,960 ft2 was retail-selling space. Our analysis is primarily calculated using GLA.
Looking at the size of stores’ backrooms gives us some insight into the types of establishments that participated in this year’s survey. Backroom size averaged about 25% of stores’ GLA, and retailing area was 75% of GLA. But, this greatly varied by store type. In supplements-focused stores, for instance, the difference between a business’s GLA (1,670 ft2 on average) and its selling space (1,389 ft2) was relatively small. These stores—which sold the least perishables (0–9% of total sales)—used only about 17% of their lease area for storage. In other words, supplements-based stores can get away with smaller backrooms, which primarily are used for inventory storage and administrative work.
Meanwhile, those with the heaviest perishables sales (55+% of total sales) had the largest backrooms (39% of GLA), which is logical because these businesses need room for kitchen space, produce prep and walk-in coolers and freezers in addition to inventory storage and administrative areas. They also had by far the largest GLA at 14,989 ft2.
Selling Stats
Sales by square footage. With a handle on store size, we can now transition to annual sales per square foot. Again, this year’s survey was our biggest yet, and several successful and well-established independent retailers provided data. The 2012 average sales per square foot (GLA) was $682/ft2, and average sales by retail area was $913/ft2.
When we break down these numbers by store type, we see that heavily perishables-focused stores (those with 55+% perishables sales) earned very high sales per square footage, with $1,037 in annual sales per GLA square foot, and $1,697 per retail-area square foot.
 As for supplements-focused stores (with five or fewer locations) that have 0–9% of sales from perishables foods, annual sales were $347 per GLA square foot, and $417 per retail-area square foot.
In other categories, we have a fairly linear relationship between perishables and sales by square foot (see Chart A). The exceptions are businesses in the 0–9% perishables group that have more than five locations. These successful supplement chains have larger square footage than other stores with a similar product mix, and far more customers per day, as we’ll discuss later.
Don’t mistake Chart A for implying that supplements-focused stores are suffering or aren’t successful. We will address other important factors like net profit and net profit percentages, which illustrate the important place of supplements stores in the natural products industry.
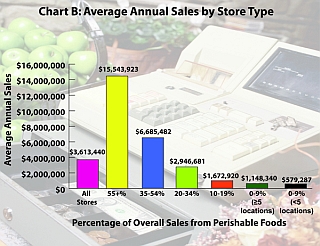
Overall sales. Together, the survey respondents averaged $3.61 million per store, but again, analyzing overall sales is most meaningful when we consider store type.
Perishables-focused stores had impressive sales of $15.5 million that were well above the overall average. The next highest sales came from the 35–54% perishables group, with about $6.7 million in annual sales. The trend continues down to the supplements-focused stores that registered an average of $579,287 in 2012. In summary, as the percentage of perishables sales declined, so did average sales (see Chart B). We will also look at these numbers through the prism of net profit in the next section.
Before moving on, now is a good time 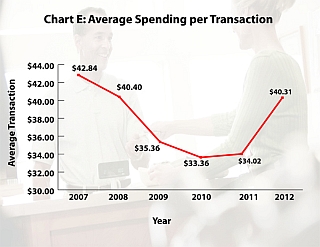 to mention that we not only asked stores about their overall sales, but also about whether sales increased or declined from the previous year. This year, a whopping 94% of stores said their sales increased over the past 12 months by an average of about 8.7%. This increase was higher than last year (6.2% in 2011). This is fantastic news for an industry that is still climbing out of some modest declines due to the down economy of years ago. In fact, this figure is the best that WholeFoods has collected in over six years (see Chart C).
There’s more good news. Previously, stores with decreases reported more and more loss every year: a 12.2% decline in 2009, a 15.3% loss in 2010, and a 19.3% decrease in 2011. We’re pleased to see this pattern broken in 2012. Respondents with losses said sales only declined 7.5%. Perhaps, we are now seeing a leveling off the “survival of the fittest” trend we noted last year. Today’s retailers are strong and resilient. The pack has been refined and those that remain will positively shape the future of the natural products industry.
The Profit Picture
Cost of goods and profit margin. Overall, stores had a 37.8% profit margin, though again, this varies by store type. In fact, small, independent vitamin chains ended up with the highest gross profit margin of all.
 While stores’ gross profit margins ranged from 34.3% to 41.7%, it’s noteworthy that the groups at the opposite ends of the spectrum were so similar: 38.8% for the perishables-heavy group and 38.7% for the smallest supplements-focused group (with less than five stores). But independent, non-public vitamin chains with at least five stores had the most desirable ratio, with the lowest cost of goods (58.3%) and the highest gross profit margins (41.7%).
Net profit. When we consider the net profits of all stores, we see an increase from 2011: 2012 net profit (i.e., cash available before taxes, but after paying for inventory and all direct-store and sales, general and administrative expenses) averaged $174,016 per store. In 2011, we recorded net profits at $88,680.
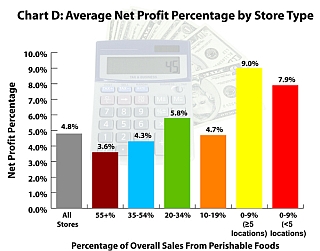
But for this number to be most helpful, it must be considered in line with net profit percentage. The average for all stores was 4.8% of overall stores (down from 8.8% in 2011) (see Chart D). When looking at net profit percentage, we can see how small, supplements-focused businesses (less than five locations) are holding their own in a diverse retail market. These establishments had a net profit percentage of 7.9%, and independent supplement chains with at least five locations were at 9.0%. Compare that with the most perishables-oriented stores; their net profit percentage averaged 3.6%.
The correlation between selling the most supplements and having a higher net profit percentage is right in line, except for a dip in the 10–19% perishables group. A trend among these stores was very small produce and prepared foods areas—two sections that pull in customers on a daily basis to purchase meal staples or ready-made items for dinner. Perhaps, these stores are suffering from perishables sections that aren’t substantial enough in these areas to boost overall profits.
As for how things shake out by the  dollars (before taxes and after all other expenses), we see a large difference in profits among small supplements stores depending on how many locations they have. Those with less than five stores averaged $45,506 in pre-tax net profits, while vitamin chain stores delivered significantly more net profit per store, averaging $103,599. Meanwhile, the largest perishables stores cranked out $561,292 in net profit.
Foot traffic and average transaction. The average foot traffic for all stores was 260 customers per day, with each transaction averaging $40.31. This is far more than last year (113 customers and average transactions of $34.02) (see Chart E).
In general, customers are attracted to stores with large perishables offerings. Thus, we saw daily customer counts differ greatly by store type. Stores with the most perishables rang up nearly half their overall sales from produce (20%) and prepared foods (23%) alone. They had about 821 transactions per day, with each transaction bringing in $52.13.
Standing out based on average transaction were the small vitamin chains, which brought in $34.73/transaction. This was the third highest transaction average of all store types, closely behind the 35–54% perishables group that averaged $36.95/transaction.

Meanwhile, the smallest supplement stores clocked in at 64 register rings per day, and their average transaction was $28.50. But remember, these stores had some of the highest net profit percentages, and we’ll also see how their operational costs can be lower than other store models.
Now, let’s take a closer look at sales by department.
Product Mix
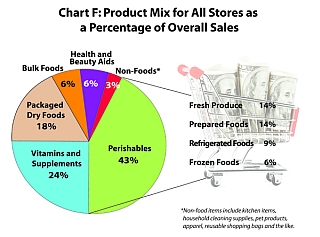
Respondents detailed their sales across nine distinct product categories (see Chart F).
Perishables. Most of the dollars counted in this year’s survey came from perishables (43.2%). Survey takers included some of the largest and most successful independent natural products retailers in the country, accounting for the seemingly high percentage of perishables in the survey. Perishables-heavy stores (55+%) averaged 61.7% of their total sales in this category. To put that into perspective, Whole Foods Markets (not part of our survey base) makes about 70% of its sales from perishables and a typical conventional chain may get 25–33% of its revenue from perishables.

Supplements-focused stores earned about 4.5% of their sales from perishable items, which stores said came from their refrigerated and frozen cases. It’s likely that supplements that typically do better refrigerated (like probiotics, flaxseed oils and others) are included in this count. Few small supplements stores, as noted previously, made any sales with produce and prepared foods. Not offering enough in these categories may limit one’s ability to attract shoppers looking to make a weekly stock-up trip in one store.
Supplements. Second to perishables, stores took in the next highest sales from vitamins and supplements. These earnings accounted for about 24% of all stores’ sales. Of course, this number shot up most strikingly for the small vitamin chains (83%) and for supplements-focused businesses with less than five stores (57%).
Meanwhile, perishables-heavy stores received only a modest percentage of sales from supplements (8.5%), though their actual dollar amount from the supplements department was more than any other store type with $1.3 million in sales.
Three groups had supplement sales in close range: $942,225 for the 35–54% perishables stores, $926,092 for the 20–34% perishables group, and about $949,945 for the independent vitamin chains. The 10–19% perishables stores brought in $760,657 from the category, while supplements-oriented retailers with four or fewer stores had an average of $332,123 in supplement sales.
Packaged dry foods. We’ve spent a lot of time talking about perishable foods, and now it’s time to talk about a grocery category from which nearly all store types earned a fair portion of sales: shelf-stable, non-refrigerated foods. This was next on the hierarchy of high-earning categories after supplements with some 17.6% of all sales from this year’s survey respondents.
Those with the biggest share of sales in this category were the medium-sized perishables stores (35–54% and 20–34% perishables), with 23.7% and 24.9%, respectively, of overall sales, and the 10–19% perishables group with 24.4%. As you’d expect, vitamin chain stores got the least sales from groceries, at just 5.7%.
Interestingly, the heaviest perishables group (55+%) had close to the same proportion of packaged foods as small pill stores; they were 14.6% and 15.7%, respectively. But, when you translate this into actual dollars, there’s a big difference in money earned from packaged foods: $2.27 million for the largest stores and $91,172 for supplements-focused businesses.
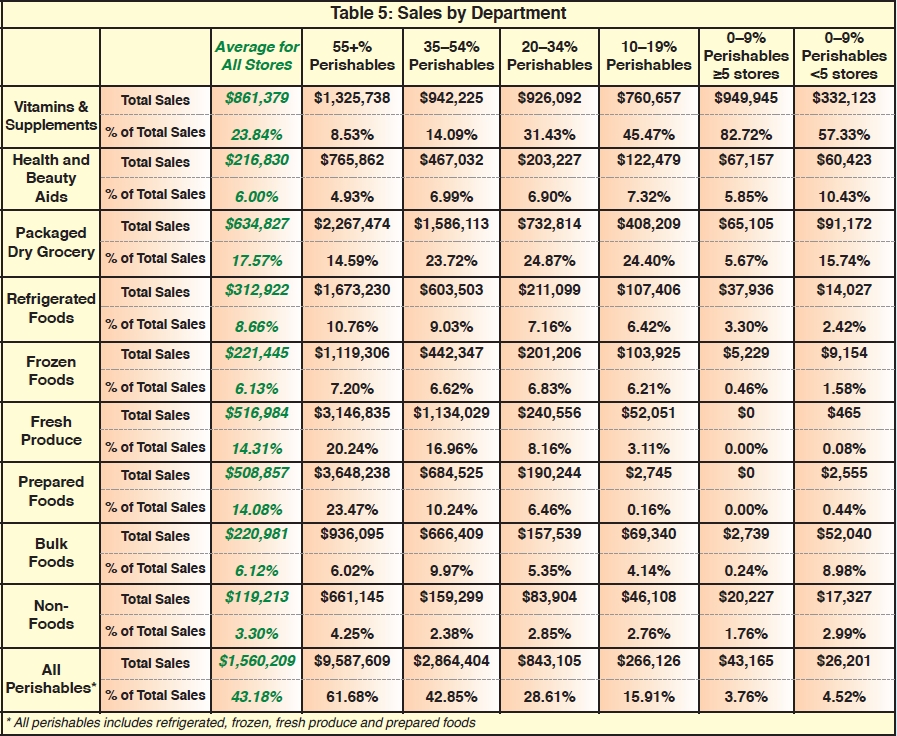
Produce. Next up is fresh produce, a big contributor to stores’ perishables earnings and our next highest-earning category. Together, stores earned about 14.3% of their overall sales from this area. No surprise, the 55+% perishables stores led the way with 20.24% of sales from produce. This equates to $3,146,835 in sales.
There was a lot of diversity among the other store groups. The next most perishables-intensive groups (35–54% perishables, 20–34 % perishables, 10–19% perishables) had 20.24%, 16.96% and 8.16% of their sales from produce. Meanwhile, the heavy-supplements stores of all sizes sold practically no fresh produce at all.
Prepared foods. Prepared foods were right behind produce in sales with 14.1% overall. We saw a similar pattern with prepared foods as with fresh produce: the larger perishables stores sold the lion’s share ($3.6 million), while supplements-oriented stores sold almost none.
Refrigerated foods. In this category (making up 8.7% of overall sales), a linear relationship was noted, with the 55+% perishables group selling the most in this area (10.8%) and the 0–9% perishable groups selling the least (2.4–3.3%). The groups in between followed suit.
Frozen foods. Sales from frozen foods comprised about 6.1% of all sales. And again, high-perishables groups sold the most (6.6–7.2%) and supplements stores sold the least (0.5–1.6%).
Bulk foods. Bulk foods also accounted for 6.1% of sales in the survey overall. The biggest earner percentage-wise was the 35–54% perishables group, with about 10% of their overall sales. The second highest were 0–9% perishables group with less than five locations. They brought in about 9% of their sales from this category.
Health and beauty aids. Stores earned an average of 6% from health and beauty aids. The smallest supplements-focused businesses had the biggest percentage of sales from these items, with 10.4% of their revenues.
Non-foods. Last, we tracked non-food items, which include everything from pet products to home goods. All stores had around the same percentage of sales here, with an average of 3.3%; individual categories ranged from 1.8% (small vitamin chains) to 4.3% (55+% perishables stores).
Store Brand Smarts
This year’s survey takers are clearly proactive and market savvy, as evidenced by their entrance into private label products. About 64% of stores offer some form of private label, a huge bump from 2011 stores (39%).
Vitamin chain stores were leaders here, with 85% of the group selling at least 51 supplements SKUs under their own brand. In fact, 77% of this subset offered more than 200 private label supplements SKUs. About 85% of the largest perishables-oriented stores had private label supplements, but far fewer SKUs (25–50).
But, it is noteworthy that supplements-focused retailers with one to five stores that have remained under the same ownership offered the lowest percentage of private label supplements: just 38%. Perhaps this is due to a perception that it is expensive, time consuming or difficult to develop a private label line. For more on how retailers can use private label as a selling tool, see this month's feature, "Keep Things Private."
Inventory Analysis
The respondents’ average retail value of inventory was $289,648, with a wholesale value of $180,752. The largest perishables stores carried the most inventory of all (valued at $850,734 retail, and $520,596 wholesale), which makes sense because they average $15.5 million in sales. Supplement-focused stores (less than five locations) carried $116,479 in inventory at retail, valued at $74,774 wholesale.
We can also estimate inventory turns (i.e., the number of times a store will turnover its entire inventory value per year). This figure varied widely by store type. High-perishables stores turn their inventories every 20 days on average, or 18.28 turns per year. Small supplements-focused stores keep inventory on shelves for 73 days on average, reflecting annual inventory turns of 4.75 times per year. When we look at vitamin chain stores, we find a bump in turns to 9.12 per year—more than either the 20–34% or 10–19% perishables stores. This is impressive given that the average customers/day in vitamin chains is far less than any of the perishables stores; these stores had a higher average transaction, however.
Labor
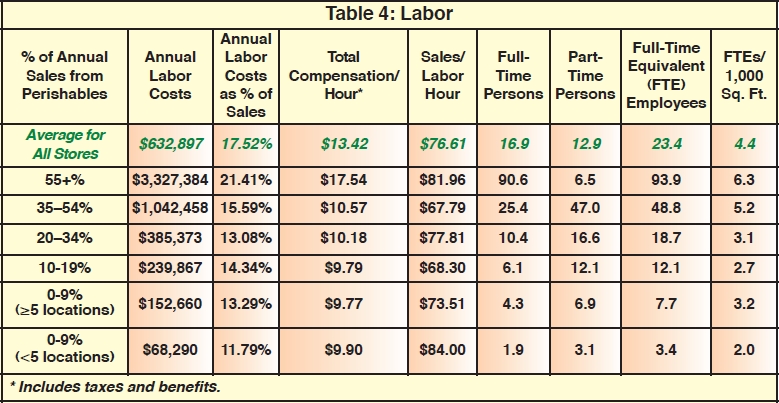
How many people does it take to run a natural products store? Well, the average store from this year’s survey employed 17 full-timers (40 hours/week) and 13 part-timers (20 hours/week). Perishables-heavy stores had the largest staff (91 full time and seven part time), while small supplements-focused stores had the least (two full-timers and three part-timers).
We can dig in a bit according to full-time-equivalent persons (FTEs) per 1,000 square feet: the average for all stores was 4.41 FTE/1,000 ft2. Again, this number varied by store type, with 6.26 FTE/1,000 ft2 running the largest perishables-heavy stores, and just 2.04 FTE/1,000 ft2 operating the smallest supplements stores.
Stores spent an average of 17.5% of their sales on labor (including taxes and benefits), the second biggest expense behind inventory. Given the volume of staff and specialized personnel needed to run a large store, its reasonable that the 55+% perishables group went above average in their labor costs (21.4%). Supplements-focused stores, with none of these labor-intensive departments, spent 11.8–13.3% on total labor compensation.
The smallest supplements stores spent $9.90/hour on compensation, while big perishables outspent them at $17.54/hour. Annual labor costs shook out to an average of $632,897/year for all stores, with the smallest supplements stores coming in at $68,290 and the 55+% perishables group spending $3.3 million. It’s possible that the supplements stores seemingly pay less as a group because owners run the stores and don’t give themselves a formal paycheck.
Nonetheless, sales per labor-hour were remarkably similar across all types of stores, averaging $76.61 for all stores. This metric ranged from $67.79 for the 35–54% perishables group to $84.00 for small supplements-focused stores.
Marketing Matters
Overall, stores' average annual marketing costs were on the low side at $49,197, which was just 1.36% of their annual sales. From a percentage perspective, smaller grocers (20–34% of perishables) and small vitamin chains spent the most (1.73% and 1.54%, respectively.)
Perhaps, part of the reason for the lower marketing expenditure is that many stores were well-established, and don’t need to spend a lot on marketing. This level of marketing is more a task of “maintenance” rather than a hard push to get out the word about a new store. Many stores surveyed, in fact, cited “word of mouth” as their most effective means of marketing.
On the Up and Up
Stores were asked about whether they anticipated sales would increase or decrease next year. Ten percent of people declined to answer the question. A massive 87% of stores believe sales will increase next year, hoping for 5–10% gains.
Only 3% of stores feel they will face declines next year; they estimate those losses at 5–10%. Based on this year’s numbers, this marks just about a $197,367 dip in sales among this group. But those who feel sales will increase may pull in a combined $49+ million more next year. This may average about a 7.4% increase overall, and is a sign of good things to come in 2013. WF
Published in WholeFoods Magazine, December 2012