As an independent retailer, you will get the most from this survey by first tallying up your sales from four main fresh-foods departments: refrigerated, frozen, produce and prepared foods. Once you find what percentage of your total sales these four categories represent, you can compare your results to similar stores in your corresponding Group—either Group 1, 2, 3, 4, 5, or 6. We organize the survey this way because perishables largely determine how large a store will be, and the sales it achieves. A store in Group 6 looks nothing like a store in Group 1, which is essentially like a Whole Foods Market. Compare your results to the results of stores only in your perishables group, as outlined in the table below.
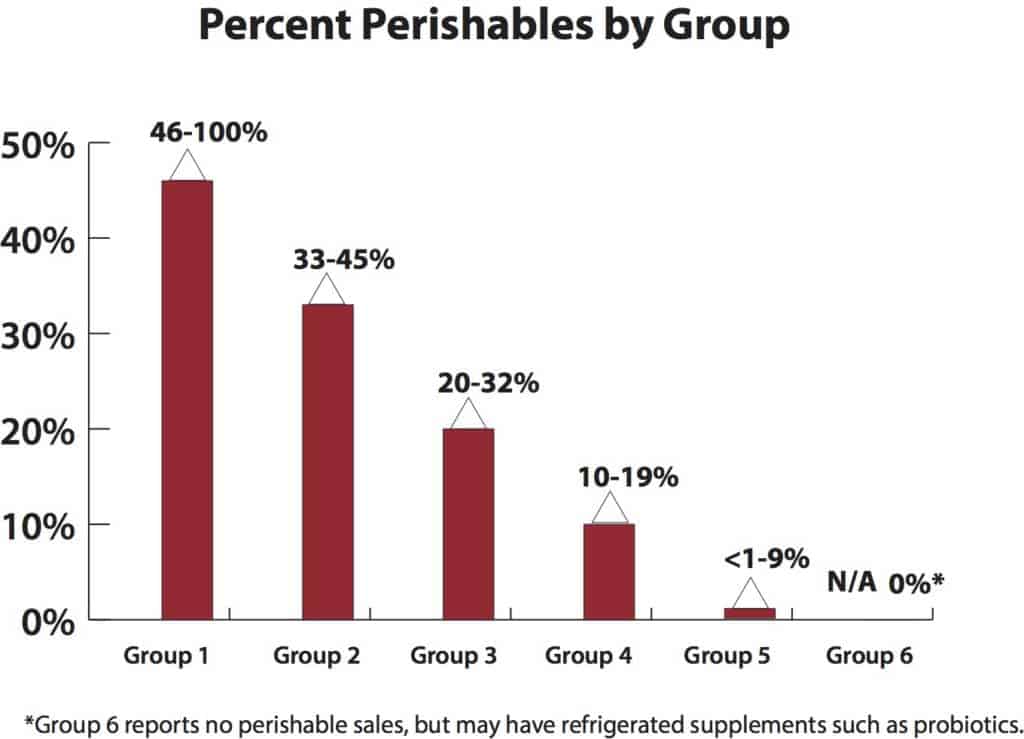
Fresh Perishable Foods Define the Store
Overall, retailers in this year’s survey sold an average of $3,067,025, of which $1,344,341 came from fresh perishables foods, representing 43.83% of sales.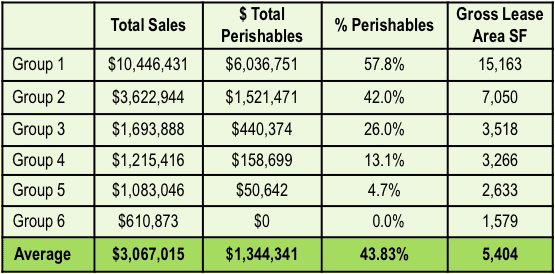
Investing in Employees
Stores with the most perishables sales, as in Group 1, require higher-skilled, higher-paid labor, including culinary professionals. And while labor as a percentage of sales was comparable to last year's survey, hourly wages decreased significantly in Group 1 ($13.18 this year versus $23.44 last year). Two reasons help explain that $10/hour difference: (1) Stores in Group 1 were 50% larger this year than last, at 15,000 square feet vs. 10,000 square feet; (2) This year we changed our methodology for full-time hours to 37.5 instead of the 35 hours we used last year. Also of note: Stores in Group 6 paid less labor as a percentage of sales and in dollars per hour. Looking at Group 6, in this year’s survey stores were larger than last year's, at 1,579 square feet vs. 2019’s 1,188, which helps explain the lower percentage dedicated to labor. Another possible factor: Owner/operators in the smallest, supplement-focused stores contribute unpaid direct labor, lowering their per-hour labor costs.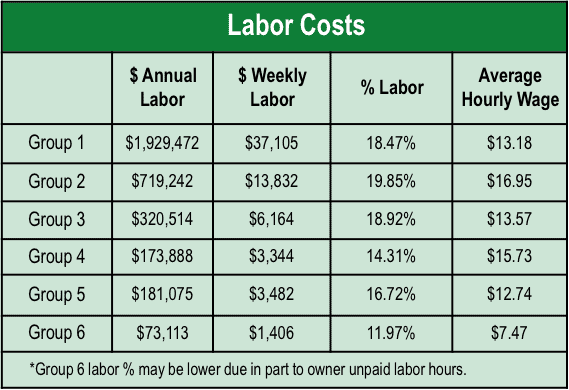 For more, watch for the full survey, which will be published in the March 2020 issue ofWholeFoodsMagazine, with additional information exclusively on WholeFoodsMagazine.com. And mark your calendar for the survey webinar on April 29 at 2:00 pm EST.