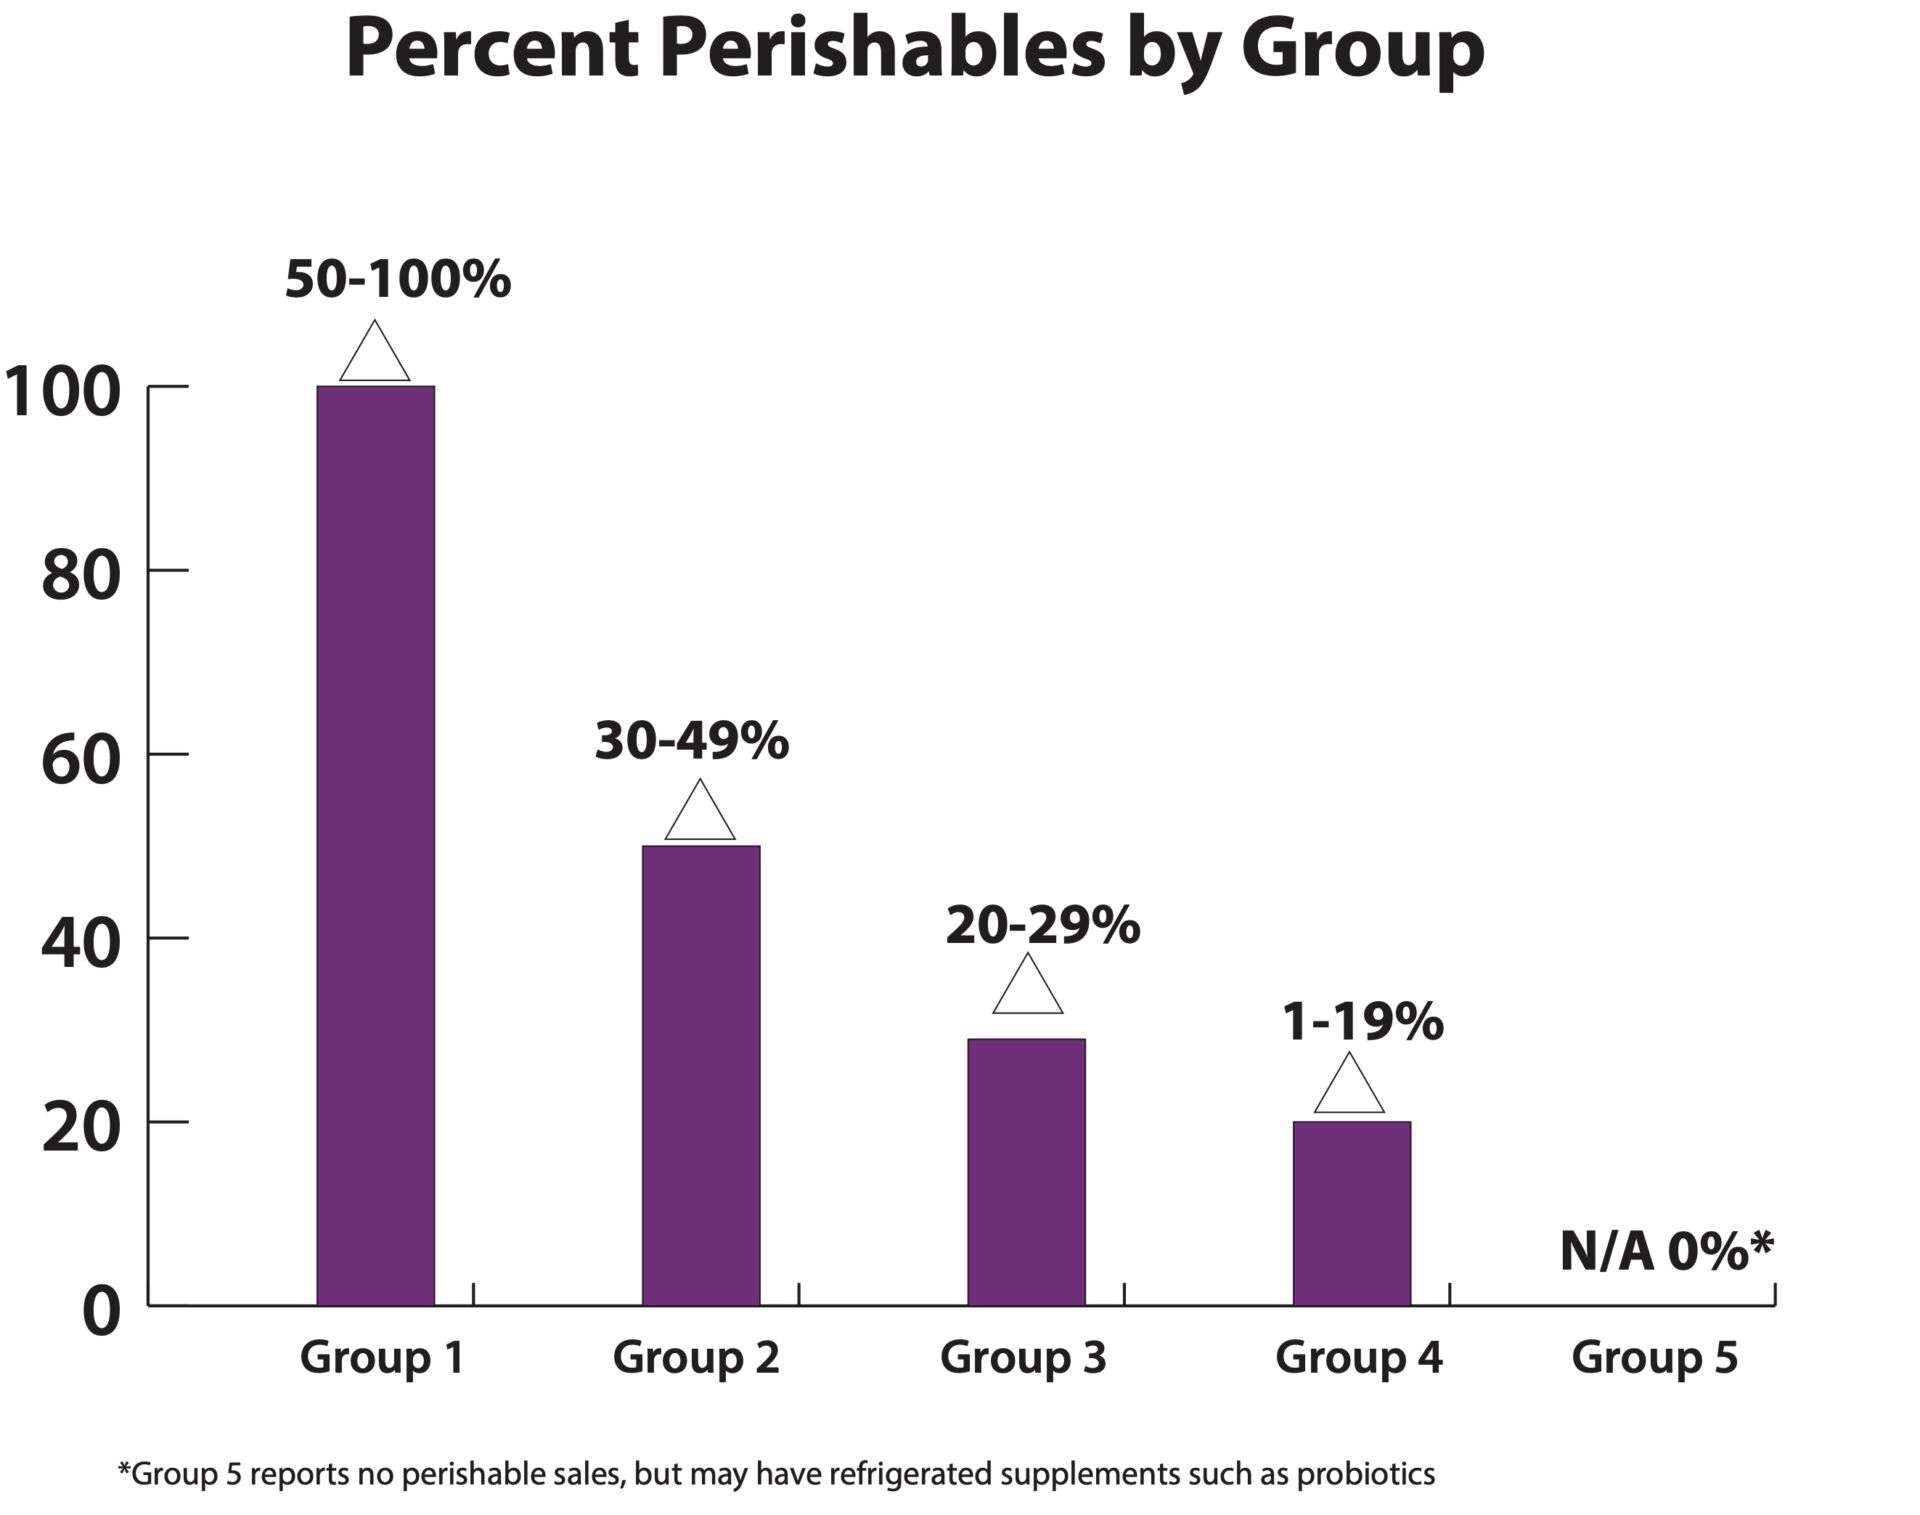
A key point to know regarding this survey: Perishables largely determine how large a store will be, and the sales it achieves. A store in Group 5, which sells no perishables, looks nothing like a store in Group 1, which offers a wide selection of perishables (think a Whole Foods Market). When using the data from this survey, you want to compare your results to the results of stores in your group. Which group are you? Find out in three steps:
Step 1: Tally up your sales from four main perishable fresh-foods departments: refrigerated, frozen, produce and prepared foods. Step 2: Calculate what percentage of your total sales these four categories represent. Step 3: Compare your results to similar stores in your corresponding Group—either Group 1, 2, 3, 4, or 5.
 Shopping and Spending
COVID-times saw more shoppers heading online, first out of necessity, and then out of convenience. Did independents meet them there? In this year’s survey, most respondents (65%) did not do e-commerce. Of those who did, 21% generated 9% or less from e-commerce sales. Another 6% got from 10% to 49% of sales from e-commerce, and 8% generated from 50% to 99% of sales from e-commerce. Regarding the consumer preference for online, one retailer told us, “Our store always gave personal service and information. We always used books such as Prescription for Nutritional Healing. The public has no idea what they are missing by relying only on the internet.”Taking Stock of Private Label
In this year’s survey, fewer than 50% of respondents said they carry private label. The breakdown:14% carry fewer than 25 SKUs
7% carry 25 to 49 SKUs
7% carry 50 to 99 SKUs
5% carry 100 to 199 SKUs
14% carry 200 or more SKUs (including one respondent with 350 SKUs)
Investing in Employees
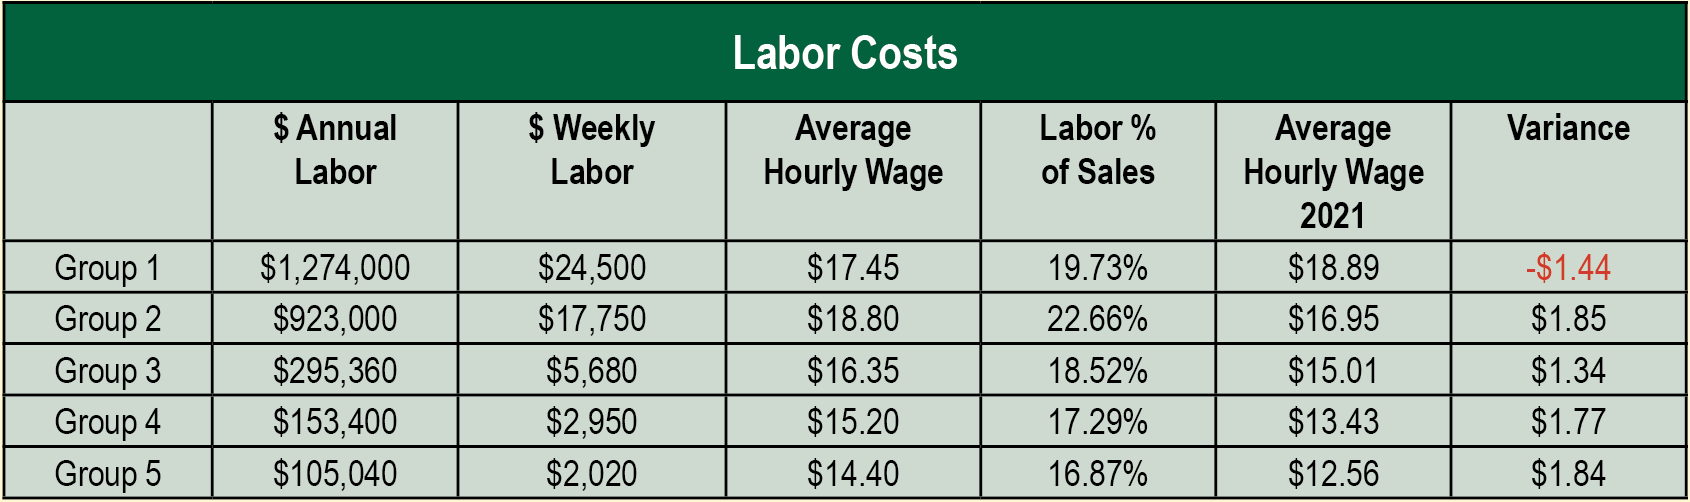
Employee retention was especially challenging during the survey period. One short-staffed respondent told us, “Along with having to raise our prices to an all time high, we have had to change hours, and close departments for one day a week to not overwork the few workers we have.” Another shared: “PPP was a lifesaver. We paid our team more and reinvested some of the saved cash on store/equipment upgrades. With COVID and staff exposure, we had to reduce our hours, but kept open.”Looking at the numbers, in four out of five groups (Groups 2, 3, 4 and 5), wages per hour rose vs. last year by an average of $1.70 per hour, as we would expect from the pandemic. The one exception is Group 1, which saw wages per hour decrease by $1.44, to $17.45 from $18.89 last year. We believe this is due to the different mix of stores that responded to this year's survey, a number of which operated more than seven stores, suggesting tighter controls on compensation.
For more, watch for the full survey, sponsored by Nutrasource and published in the March 2022 issue of WholeFoods Magazine, with expanded content exclusively on WholeFoodsMagazine.com. And stay tuned for details of our survey webinar, where you will be able to get your questions answered.