No one will argue that the past 12 to 18 months have put a strain on many businesses throughout a variety of industries. Consumers were spending less and the cost of goods rose, while banks tightened up on credit. An indicator of this economic trouble was the preponderance of vacancy signs mounted on once prosperous stores, both big and small.
Given this backdrop, it’s especially striking that the 2009 WholeFoods Retailer Survey indicates that many independent natural product stores have had a good year, and many reported increased sales over the survey period (September 1, 2008 through August 31, 2009). While some businesses have cut back on staff and reported drops in sales, a good portion of shops is thriving.
This survey will present a snapshot view of how independent stores fared this year to help pinpoint the best strategies for natural products stores to be successful.
 Overall Sales Up in 2009
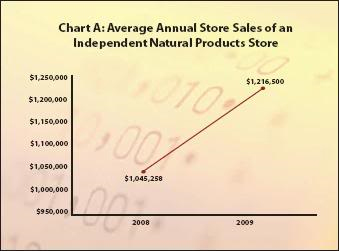
Again, despite the economic uncertainty of the past 18 months, WholeFoods can report that independent stores participating in its 2009 survey had a 16% overall increase in sales compared with 2008 figures ($1,045,258 sales in 2008 versus $1,216,500 in 2009, see Chart A). This year’s survey attracted many higher-volume retailers.
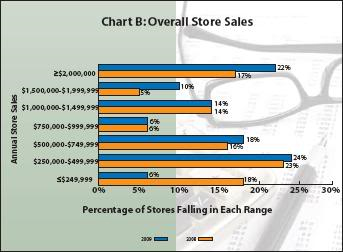
Businesses in the highest bracket of overall sales ($2,000,000 and above) comprised a large portion of all respondents (22% in total, see Chart B), whereas only 6% of respondents fell in the lowest range ($249,999 or less). Average sales per square foot also are up this year, as they grew from $406/ft2 in 2008 to $413/ft2 in 2009. This makes sense given that the average square footage per store was slightly less this year (2,967 ft2 in 2008 versus 2,919 ft2 in 2009).
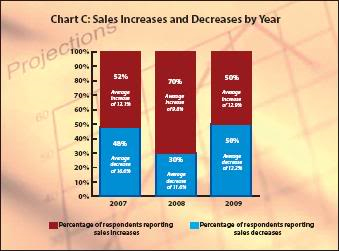
 Other data point to the fact that the industry is still growing, but possibly in a different way. Fewer stores are reporting growth in sales than in previous years (70% grew in 2008, 50% grew in 2009). But, the 50% of stores that experienced sales growth have had more substantial increases in sales than the year before (see Chart C). In fact, those who rang up more business in 2009 had nearly 32% more growth in sales than the 2008 respondents reported (a 9.8% growth in 2008 compared with a 12.9% growth in 2009).
One ironic twist is that the 2009 numbers for this survey question were split squarely down the middle, with the actual percent increase and decrease differing by just a fraction of a percentage point. This year, 50% of stores said their sales were up by 12.9%, while the other half said their overall sales dropped 12.2%.
 What’s going on here? One can assume that stores that have the right product mix for their clientele, have a strong customer base, have excellent management and offer smart promotions/advertising will be stable or will grow even when customers are tightening up on their spending. Conversely, while some stores’ sales dropped for reasons beyond their control, it’s likely that many shops with plummeting sales can do more to turn the ship around. For example, re-examining product mix, how they advertise to shoppers and how they staff their shops may help reel in additional business.
Let’s test this theory.
 What Kind of Store Are You?
In order to be profitable, one must manage the delicate balance of product mix. This is far from cut and dry. Factors such as a store’s footprint and the unique needs and characteristics of one’s clientele contribute to successful sales.
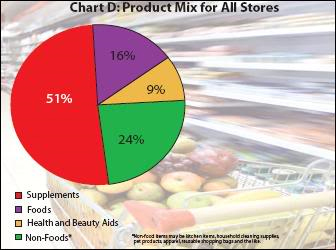
This year, respondents said over half of their sales came from dietary supplements and a quarter from foods. Sales of non-foods (16%) and health and beauty aids (HABA, 9%) brought up the rear (see Chart D). This is interesting because HABA product sales among survey participants represent a higher total percentage of overall sales than in most natural products stores (typically about 5–6%, according to industry experts). This could indicate that this year’s survey takers are high-caliber, well-managed stores, which we believe to be the case. Some of the later findings supports this thought as well.
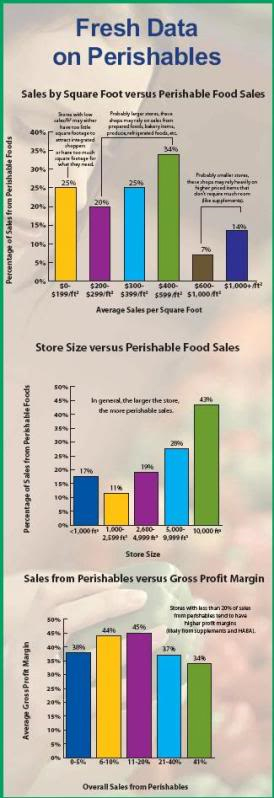
 Looking at data from all respondents, the average total sales from perishables was 19%; about 16% of all survey respondents said they don’t offer perishables at all. Perishables include frozen, refrigerated, dairy/non-dairy, fresh produce, prepared foods, grab-and-go foods, bakery, deli, cheese, coffee/juice/smoothie bar and the like.
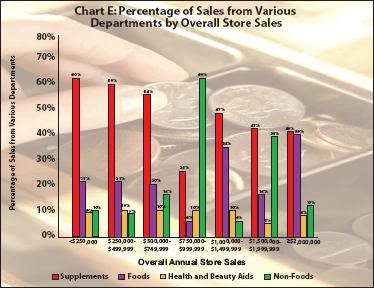
One can compare product mix versus overall sales and find some general trends, though they aren’t completely linear. As overall store sales increased, supplement sales as a percentage of overall store sales decreased somewhat; meanwhile food sales as a percentage of overall store sales tended to rise. In this year’s survey, percentage of sales from HABA products stayed more or less the same across all respondents regardless of their overall revenue (see Chart E).
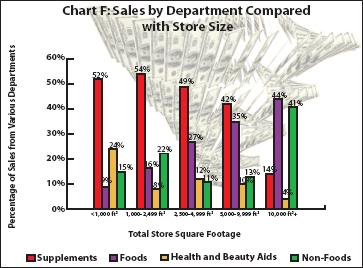 When you throw in store footprint, some intriguing data present themselves. In many cases, the bigger the store’s size, the smaller the percentage of supplement sales and the larger the foods. Take stores that are less than 1,000 ft2. These businesses said about 52% of their sales came from supplements, 24% from HABA, 15% from non-food items and 9% from foods. Conversely, the largest stores surveyed (more than 10,000 ft2) said that food made up the largest portion of their sales (44%), followed by non-foods (41%), dietary supplements (14%) and HABA (4%) (see Chart F). Non-food items may comprise kitchen items, household cleaning supplies, pet products, apparel, reusable shopping bags and the like.
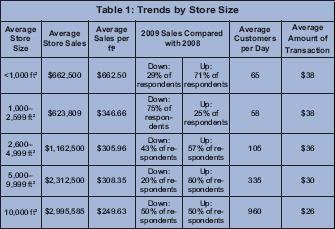 Most likely, these data aren’t a surprise. But what might be unexpected is the one range that doesn’t follow this trend: stores that are 1,000 to 2,599 ft2. These stores relied heavily on supplement sales (54%), but also indicated that food is an important moneymaker for them, garnering 16% of sales (see Chart F). This group brought in the lowest overall sales ($623,809), reported having the fewest customers per day (58 people) and had the largest dip in sales this year (15%) (see Table 1). Also telling is the fact that more respondents in this bracket than in any other range experienced a drop in sales from the previous year (75% of total respondents in this range).
What’s at work here could be that many of these stores are in somewhat of a no man’s land; their space dedicated to foods is too small to attract “integrated shoppers,” and they don’t need all the space they’re renting to be mainly a pill shop. Last month’s Merchandising Insights column by merchandising editor Jay Jacobowitz, CEO of Retail Insights, suggested that the newest buyers providing the lion’s share of growth for natural and organic products are “integrated shoppers.”
 Such consumers aren’t like the dedicated all-natural/all-organic shoppers at the core of the natural products industry. Instead, today’s “integrated shoppers” are picking and choosing as they start to integrate only certain natural and organic items into their households. This group is comprised mainly of those who frequent large traditional supermarkets and want to make all their purchases in one place.
To attract these folks, some businesses that were once only “pill stores” may have started adding some food and perishable items to their product mix. But proceed with caution when following this route. Food attracts some shoppers, but the profit margin is far lower than that of supplements or HABA items. A mainly vitamin store can really only compete with large supermarkets if they significantly increase their footprints. Per the WholeFoods survey data, a supplement store can generate decent sales if it remains small and focuses on its supplement knowledge and customer service. Simply doubling and, in some cases, tripling one’s footprint may not double or triple sales—even with the installation of a couple shelves of food products. In a nutshell, to attract the new “integrated shopper,” one’s store may need significant perishable offerings to be more than just a “fill-in store” for specific items that can’t be purchased during a big weekly grocery shopping trip at a mainstream store. Instead, having perishables makes a natural products store a viable option for major grocery shopping or assembling dinner.
 It’s not impossible, however, for a 2,500-ft2 store with a couple grocery aisles to see great profits; it may just take extra effort and an intelligent business plan. If stores haven’t fully committed to this, then they may consider staying small and focusing on supplement sales.
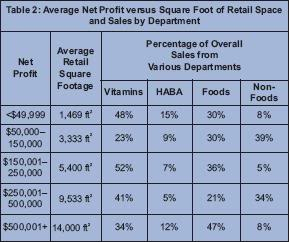
It also should be noted that businesses with the smallest sales seem to be doing a good job with their HABA offerings, which often have solid margins. Consider the data presented in Table 2. Stores with the least net profit generate a larger portion of earnings from HABA than any other group.
Ready for a Growth Spurt?
The floundering real estate market could be a blessing in disguise for businesses that are thinking of adding another store or expanding their present locations. Small businesses that are doing well in this economy may be eyeing up a great leasing deal or property steal for a possible store addition or expansion. Could now be the time to take such a risk?
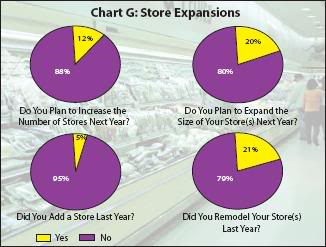
 Well, it seems that many businesses responding to this year’s survey were more or less cautious about making such a move this past year, and few expect to do so next year (see Charts G). Last year, 15% of survey takers said they anticipated adding a new store during 2009. But, only 5% followed through with such plans this year, which makes sense because the 2008 survey was taken before the economic meltdown. Nonetheless, businesses that added another retail location did so with gusto; such firms averaged three new stores that were about 5,750 ft2 each. And, shops that made improvements to existing stores spent about $66,636 on remodeling an average of 2,718 ft2. This equates to about $25.51/ft2 in renovations.
 Small businesses that are considering an expansion must properly plan in advance in order to be successful. Here are some tips for how to do so:
- Do some research to determine what type of expansion is right for you. Try to learn from other businesses in your area that expanded and were successful (or failed).
- Determine exactly how you will benefit from an expansion and be honest with yourself about the challenges you may face. Will you have access to a new customer base? Can you handle the stress of multiple locations?
- Carefully lay out exactly how you will fund the expansion, particularly taking into account cash flow into and out of the expansion over the course of a few years. Expansions are safest when you’ve had steady growth of your bottom line over the past several years.
- Prepare a business plan for your new location.
- Select a location that is best for your business, not just what’s best for your bank account (1, 2).
 Foot Traffic
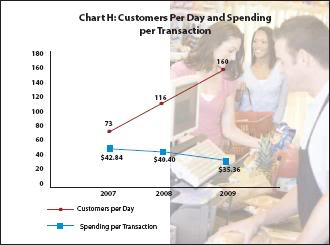
Another strong indicator for our industry is that foot traffic was up, with a 38% increase in customers per day (from 116 to 160 shoppers daily). This is the third consecutive year that stores reported having more shoppers daily. Sales per transaction are down slightly (see Chart H), which may indicate more frequent, but less expensive purchases thanks to a greater daily perishable sales versus supplements.
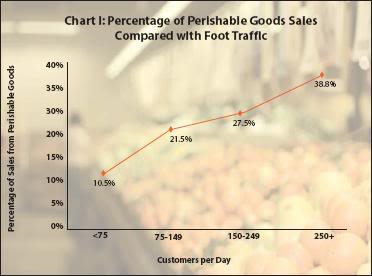
Data from all respondents were broken out by total customers per day to see what could be working for the highest volume shops. This analysis brought more evidence that food products, particularly perishables, might be luring shoppers into stores. The stores with the most foot traffic had the highest percentage of sales from perishable items. Stores with 150–249 customers per day said 27.5% of their overall sales came from perishables, and stores with 250 or more customers per day said 38.8% of overall sales came from perishables (see Chart I).
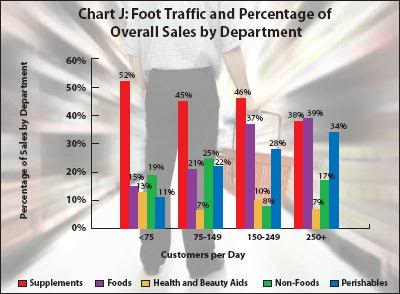
 One can see this trend better when looking at it by store type. The larger the role of foods (and especially perishable items) in a store’s makeup, the more customers will come through the door (see Chart J).
Another crucial aspect of growing and maintaining a steady stream of customers is to use good advertising. Many marketing gurus will tell you that one shouldn’t drop an advertising budget when times are tough. Though 44% of respondents said the economy is the biggest problem they are facing today, stores that placed ads this year increased their advertising budgets by about 148%!
This year, respondents with a marketing budget said they spent about $2,968 per month on advertising, whereas in past surveys, respondents said they only shelled out $1,198/month on advertising in 2008 and $1,252/month on advertising in 2007. Again, these figures speak to the quality of the respondents to this year’s survey, who are clearly forward-thinking, market-savvy retailers.
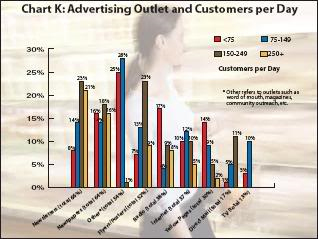
 As for how they are advertising their stores, shops with the most foot traffic (150–249 and 250 or more customers per day) seem to favor store newsletters, spending the largest percentage of their marketing budget on this form of advertising (23% and 21%, respectively) (see Chart K). This is interesting, given that only 13% of all stores use this form of advertising.
Stores also were asked to comment on their most successful marketing strategy last year, which included:
- Advertising in print (newspapers, local magazines) and on local television and radio programs. Several stores reported having success with hosting a radio Q&A with a nutrition expert from their stores.
- Updating outdoor signage to attract new customers, and tweaking indoor signage to highlight various sections of the store.
- Sponsoring local community functions such as children’s sports teams, fundraising events or local marathon races.
- Scheduling interesting store events with tastings and memorable key speakers.
- Using e-mail addresses from shoppers (or other online media) to advertise store sales and special coupons/discounts to online communities.
- Focusing on some promotional basics (bag stuffers, in-house literature, etc.) worked best for some stores.
- Last, sponsoring a relevant fundraiser in the store (e.g., you’ll donate 5% of proceeds from your January pet supplements/supplies sales to a local animal shelter).
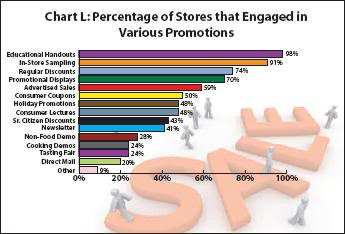
Chart L offers some insight into which promotional programs stores used this year.

Face Time
Respondents to this year’s survey averaged about seven full-time and 12 part-time employees (see Table 3). Given that the average square footage for this year’s survey is 2,919 ft2, one can estimate that this year’s respondents had the equivalent of four to five staff members per 1,000 ft2 (we assumed that two part-time staff members equals one full-time employee, and we refer to this as full-time equivalent employees).
 Keep these figures in mind when you consider that one yardstick of customer service is the staff-to-store size ratio. Some experts feel that successful stores without perishables should have about two or three full-time equivalent staff members for every 1,000 ft2. Those with perishable offerings should bump up their teams to five or six equivalent employees per ft2. In fact, in the largest cohort of this survey, retailers had seven full-time equivalent employees per 1,000 ft2.
Private Labeling Trends
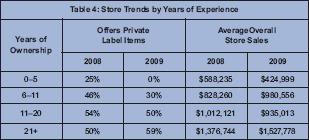
 This year, about 44% of respondents said they have a store brand. Like last year, WholeFoods compared these data with store owners’ years of experience and again found that the longer the store is under current ownership, the more likely it is to offer private label items. These stores also had the largest overall sales.
Stores that did offer private label items averaged a total of 155 SKUs and listed the following items as their most successful offerings:
- Multivitamins/ minerals
- Vitamin C
- Heart health items such as those for healthy cholesterol levels and blood pressure
- B-complex
- Glucosamine
- Omegas. WF

References
- D. Rinaldi, “Should I Expand My Business?” www.entrepreneur.com.
- C. Sayder, “Small Business, When to Expand,” The Amper Review, fall 2009.
Published in WholeFoods Magazine, December 2009


