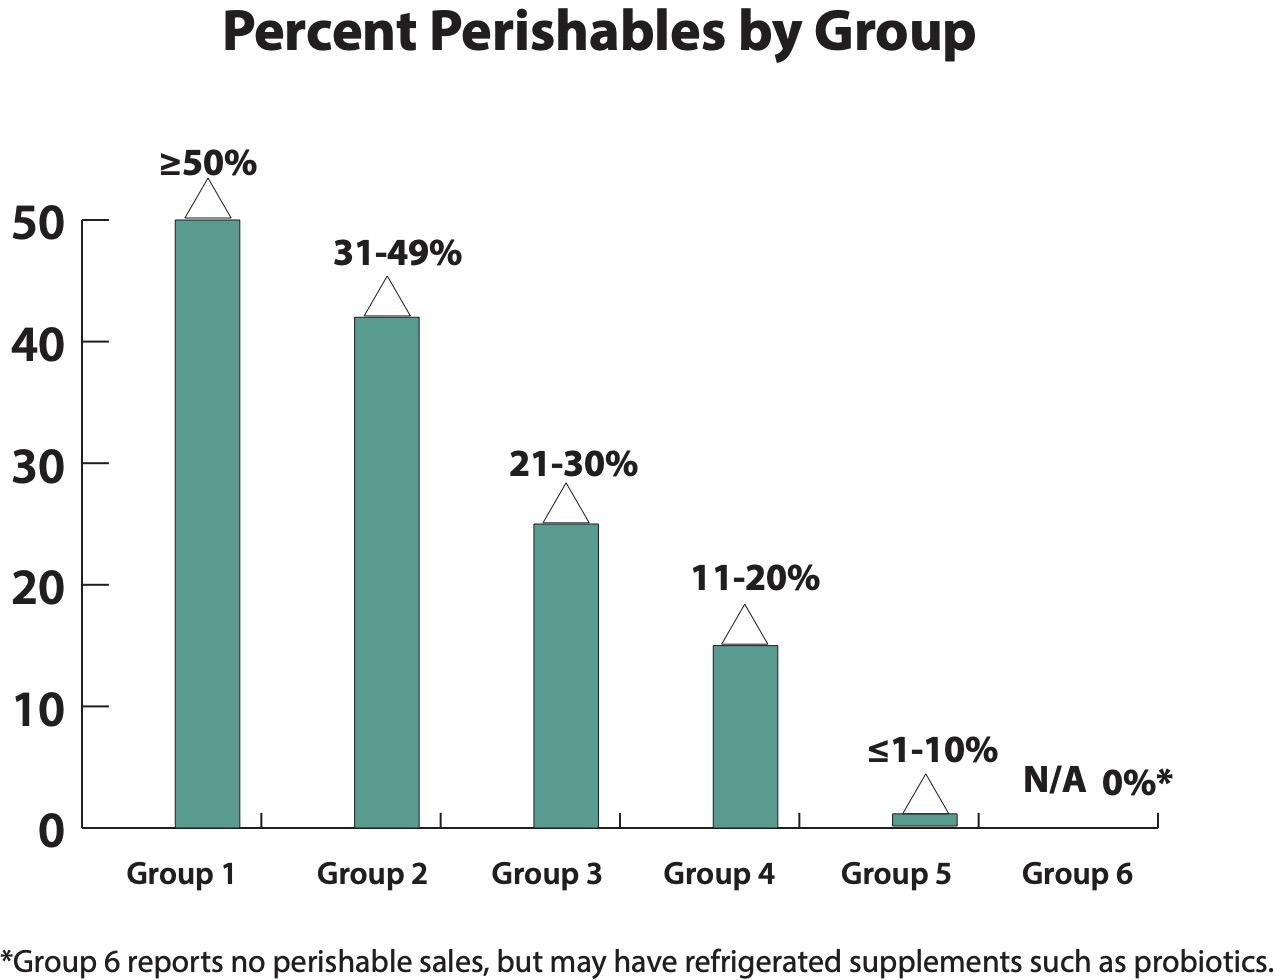
As an independent retailer, you will get the most from this survey by tallying up your sales from four main perishable fresh-foods departments: refrigerated, frozen, produce and prepared foods. Once you find what percentage of your total sales these four categories represent, you can compare your results to similar stores in your corresponding Group— either 1, 2, 3, 4, 5 or 6. Why do we organize the survey this way? Perishables largely determine how large a store will be, and the sales it achieves. A store in Group 6, which sells no perishables, looks nothing like a store in Group 1, which is essentially like a Whole Foods Market. When using the data from this survey, be sure to compare your results to the results of stores in your group.

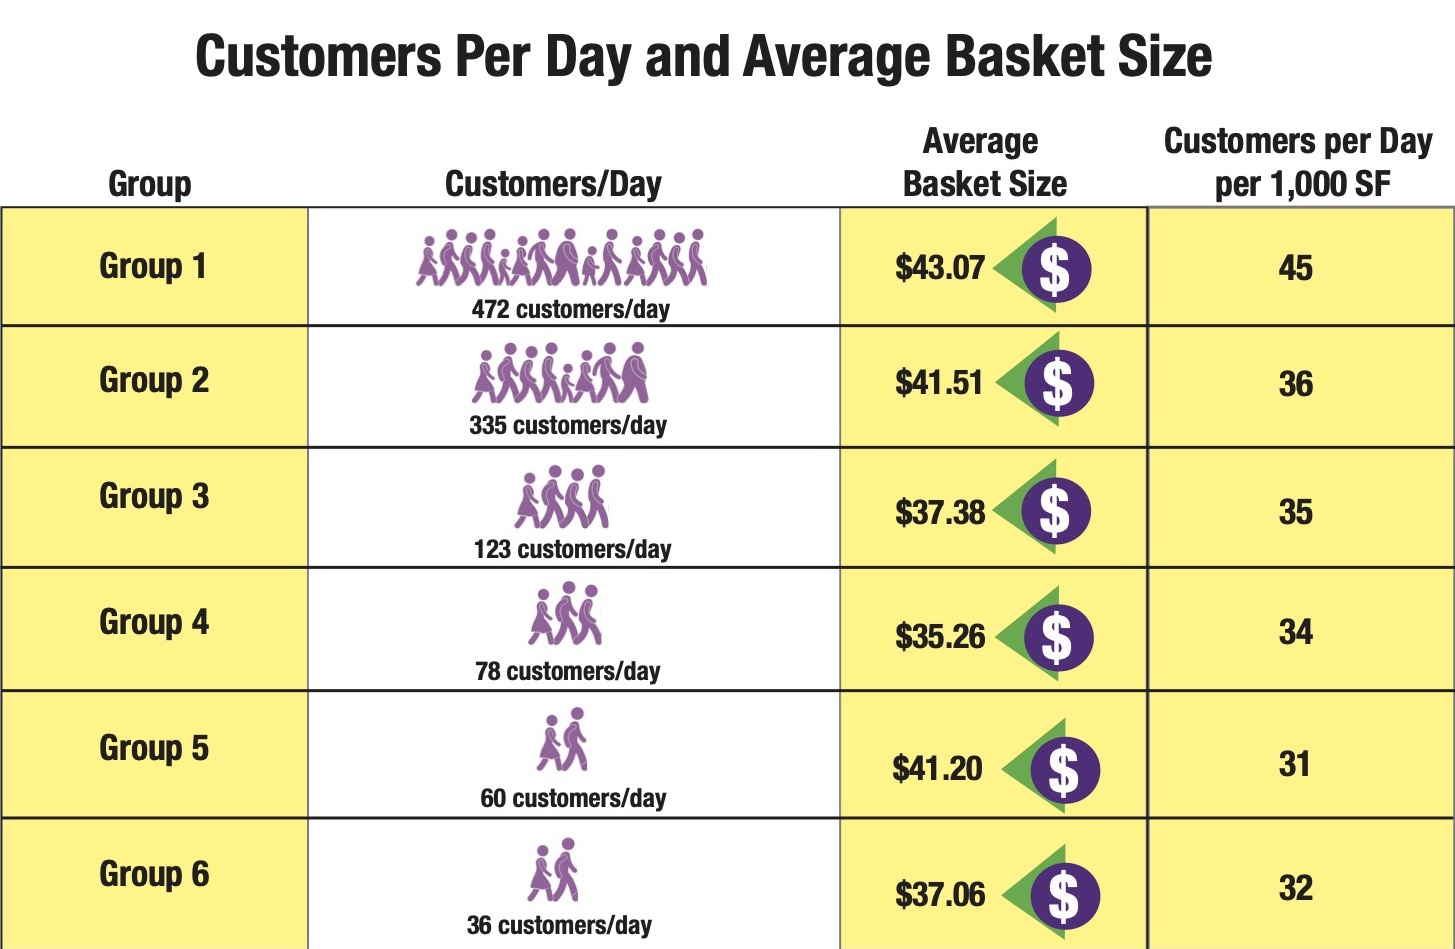
Shopping and SpendingCustomers per day increase with store size and percentage of fresh, perishables foods, ranging from 36 per day in stores that sell no perishables, to 472 per day in stores that get at least 50% of sales from perishables. Average basket size ranges from $35.26 in Group 4 to $43.07 in Group 1, our high-perishables food stores. Group 4, with 11% to 20% of sales from perishables, and 2,300 square feet GLA on average, are perhaps neither large enough, nor carry enough fresh foods, to attract a daily grocery clientele, helping explain their low average basket size. It helps to focus on supplements and vitamins, as we can see from Group 5’s results. These stores average 1,900 square feet, generate 60 customers per day, and average $41.20 per transaction.
As far as online goes, 61% did not sell online. Of those brick-and-mortar retailers that do sell online, 23% generated less than 10% of their sales from online purchases. Those that got 10% to 19% of sales online, and those getting up to 100% of sales, made up 8%eachof all respondents.
Overall, 58% of respondents’ stores are open six days or fewer per week, with 42% open seven days. This comports with our respondents being mostly single-store independent retailers, in locations that often do not require seven-day operation.

Embracing Private Label Many more stores have adopted private label supplements and vitamins compared to prior year's surveys. Nearly six in 10 (57%) now carry some private label, up from about 33% in prior years. Many stores appear to be just starting (42%), carrying up to about two dozen SKUs:
|
42% carry up to 24 SKUs |
|
33% carry 25 to 99 SKUs |
|
12% carry 100 to 199 SKUs |
|
12% carry 200 or more SKUs |
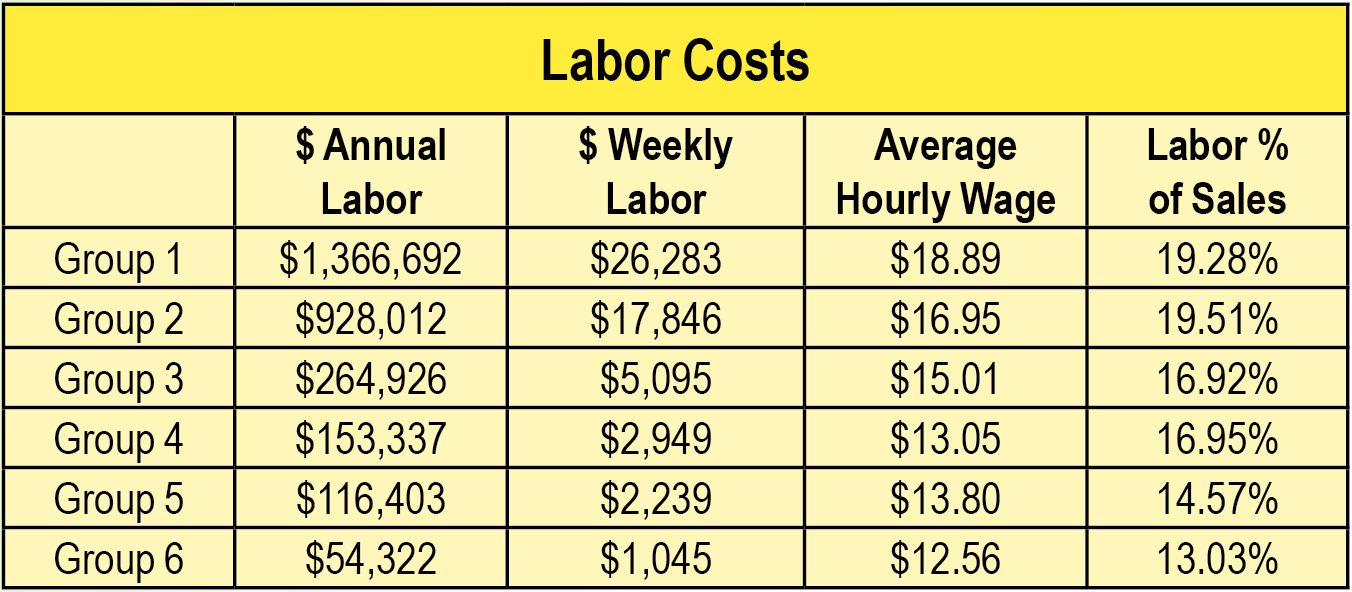
Investing in EmployeesAs you might expect, stores with lots of fresh foods departments require more staff with more complex skill sets. These folks make more money than general retail help. So we see, with hourly wages pushing $19.00 per hour ($18.89) in Group 1, our high-perishables stores, and drifting down to $12.56 per hour in the supplements-focused stores in Group 6. Likewise, labor as a percentage of sales increases as the complexity of the food operation increases, climbing from 13.03% of sales in stores with zero perishables, to over 19% for high-perishables stores in Groups 1 and 2.

For more, watch for the full survey, sponsored byNutrasourceand published in the March 2021 issue ofWholeFoodsMagazine, with expanded content exclusively onWholeFoodsMagazine.com. And stay tuned for details of our survey webinar, where you will be able to get your questions answered.


