Sponsored by

A record number of independent natural and organic products retailers responded to the WholeFoods Magazine 40th Annual Retailer Survey. Here are highlights of the results and you can see how your store stacks up against its peers.
For this year’s survey, conducted with Readex Research, we asked for results for the 12 months ended June 30, 2017. (Note this does not include the impact of Amazon’s acquisition of Whole Foods Market at the end of August, 2017, and its ripple effect on other retailers. That impact —which may very well be positive, as Whole Foods Market does away with direct-vendor sales to its stores and regions—will be reflected in next year’s results.)This year’s survey attracted 27% more independent retailers than last year’s survey. Many of these were successful, smaller stores, with medium or lower amounts of perishables sales, reflected in Groups 2 through 5 as defined below. Overall, the total sales of all survey respondents were $1,843,450,602, a 16% increase from last year’s $1.59 billion survey total.
Respondents were optimistic, with fully three in four (74%) telling us their sales grew or stayed the same, and almost all (96%) expecting sales to grow or remain stable this year. And retailers are putting their money where their mouths are, with 16% saying they expanded last year and with 21% planning to expand this year.
Although the $1.84 billion sold by independents in this year’s survey is a large number, it represents just 16% of the $11.48 billion all U.S. independent natural retailers sold in 2017. And, for the U.S. overall, the $11.48 billion sold by independents represented a 14.52% share of the $79 billion in total natural organic sales through all eight retail and food-store channels in 2017. For a complete update of the U.S. natural organic retail market, see the Retail Insights® 2018 Retail Universe for Premium Natural, Organic Food, Supplement & Personal Care Sales. The Retail Universe covers all eight retail channels including supernaturals such as Amazon Whole Foods Market and Sprouts Farmers Market; conventional supermarkets; mass merchandisers, pharmacies and vitamin chain stores.
Mark your calendar for our webinar on Tuesday, April 24, at 2:00 p.m. Eastern.
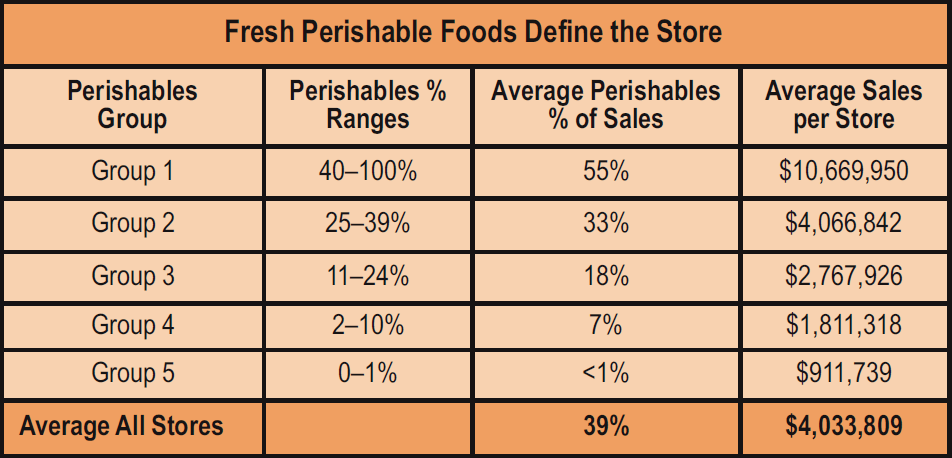
How to Use This SurveyTo compare your store to others, first total up all your perishable food sales in the four fresh categories: refrigerated, frozen, produce, and prepared foods. Divide your total perishables sales into your overall total store sales. This will give you your total percentage of perishables sales. Your store will fall into one of the five perishables groups. Compare your results to the results of stores only in your perishables group. (See Figure 1.)
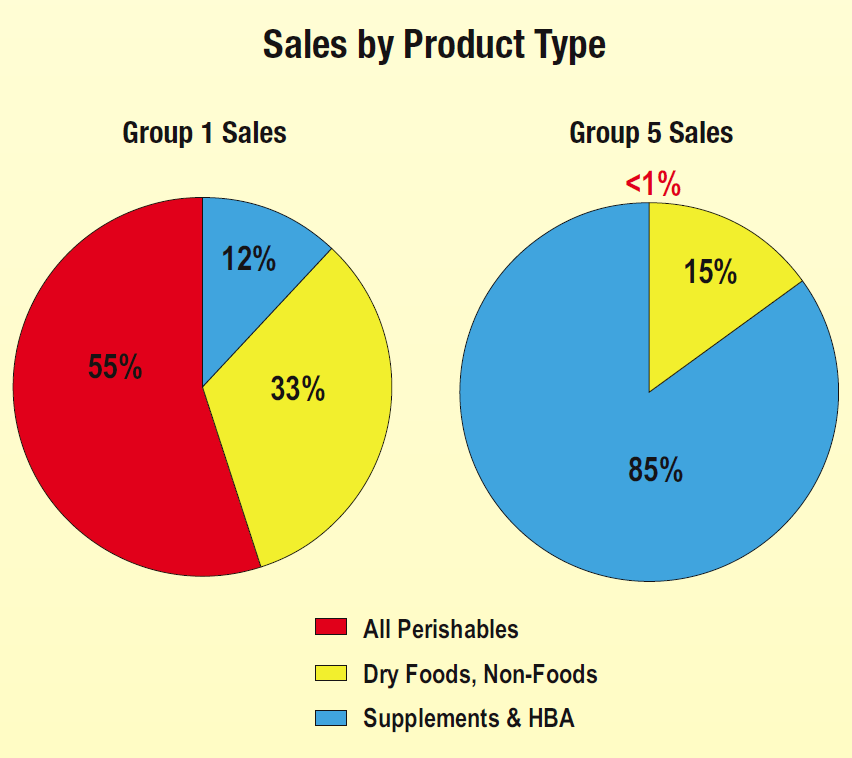
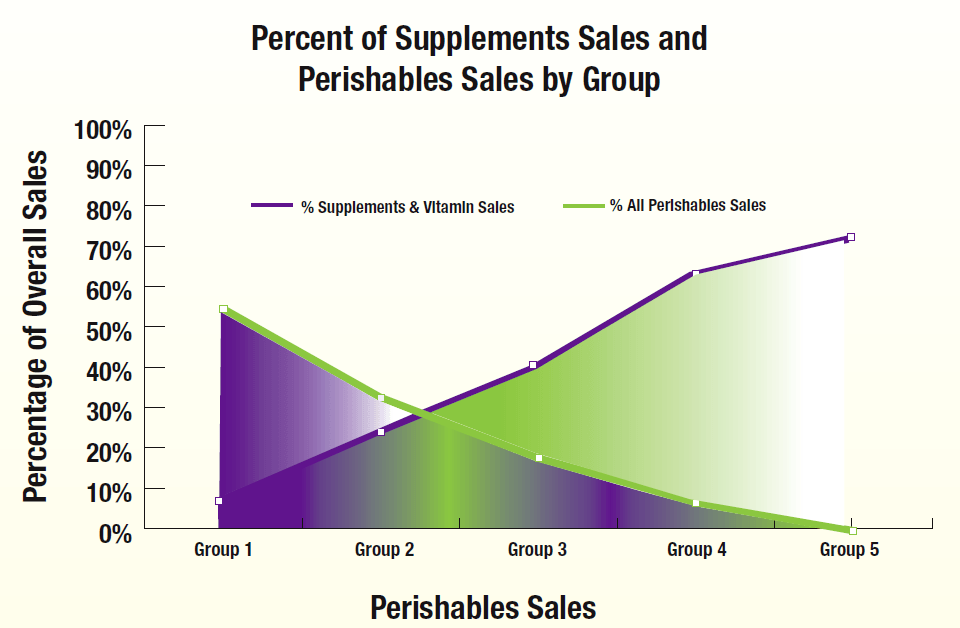
Vitamins and SupplementsAs independent natural organic stores sell fewer fresh foods, they sell many more vitamins and supplements. This year’s respondents confirmed this trend, with the highest perishables stores in Group 1 getting just 7% of their sales from vitamins and supplements, while stores selling the least fresh foods, in Group 5, got nearly three out of every four sales dollars—72%— from vitamins and supplements. (See Figures 2 and 3.)
Survey RespondentsMost survey respondents (62%) operated one natural organic store, and 12% had two stores. Four percent of respondents ran three stores, and 3% of our survey base had four stores. Retailers that ran five and six stores each accounted for 1% in the survey, while 9% of survey respondents had seven or more stores, with the median respondent in this group operating seventeen (17) stores.
Independent retailers participating in the survey owned their real estate 35% of the time, and rented 65% of the time.
Respondents came from every part of the country, all 50 states, the District of Columbia, and Puerto Rico. Stores from the Mid-Atlantic, Midwest, and Southeast U.S. represent about 22% of respondents each. Stores from the West Coast and Hawaii made up 12% of respondents; New England and the Southwest U.S. each contributed 8% of responses; stores in the Mountain Region represent 5% of respondents, and Alaska stores contributed 1% to our results.
Stores in this year’s poll were the oldest, longest-serving retailers in the history of the survey. Current owners have operated their stores for an average of 29.5 years, and their stores have been in business for a total of 34.6 years.
This year’s survey also covers every type of trade area in the country, from rural areas and towns of less than 50,000 people to major metro areas with 1 million population or more. Total square footage of respondents increased 17%, to 2,957,900 square feet, in the 2018 WholeFoods Magazine Annual Retailer Survey, from 2.53 million square feet in the 2017 Survey.
Average GLA (Gross Lease Area) decreased 8% in this year’s survey to 6,472 square feet from 7,046 square feet in last year’s survey, due to a greater number of smaller stores responding.
Average retail square footage decreased slightly by 2%, to 4,868 square feet from 4,988 square feet in last year’s survey, again due to many more smaller stores participating in this year’s survey. (See Figure 3.)
Retail Space vs. Back-Room Support AreasAs stores sell more perishables, they need larger receiving areas, walk-in coolers and
freezers, produce preparation areas, and commercial-grade kitchens. This greater need means a larger percentage of space goes to these back-room support areas, and a smaller percentage of space goes toward retail selling space.
Because this year’s survey attracted many smaller stores that sold fewer perishables, overall back-room, non-retail areas in the survey decreased as a percentage of total GLA, allowing front-end retail areas to grow to 75% compared to last year’s 71%.
Average SalesAs in prior years, stores selling the most perishables have the highest average sales. Overall, for all survey respondents, average annual sales were $4,033,809, about 9% lower than last year’s $4,429,937. Again, this is because many more smaller stores participated in this year’s survey, bringing the overall average down slightly.
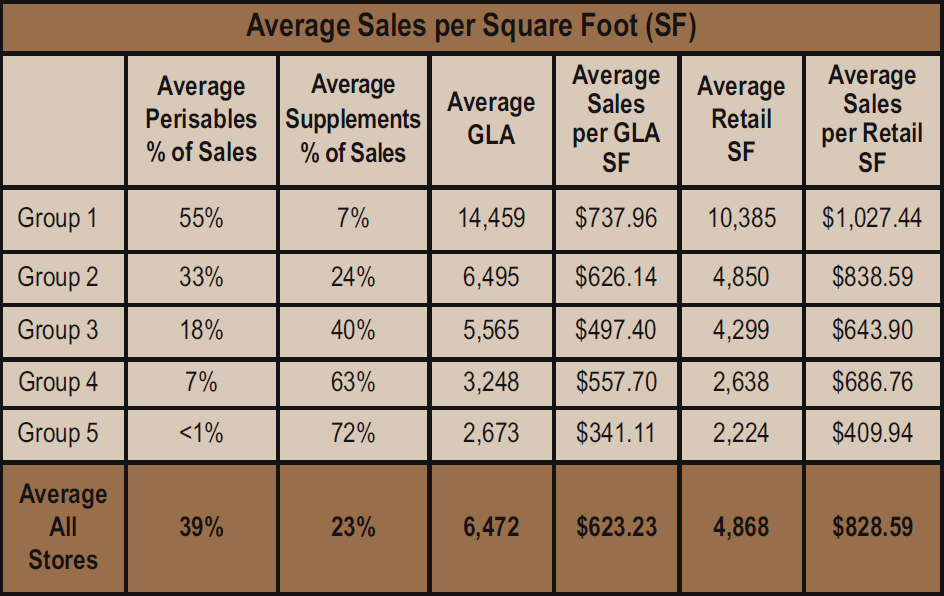
Average Sales per Square FootWe report sales-per-square-foot for the total store — Gross Lease Area or GLA — and for the retail selling area alone, which excludes the non-retail back-room support areas.
Overall, stores sold an average of $623.23 per GLA square-foot per year, and $828.59 annually per-square-foot counting just the retail selling space of the store.
Sales per GLA square foot ranged from a high of $737.96 for stores in Group 1 that sold the most perishables, to a low of $341.11 for supplement-focused stores in Group 5. Sales per retail square foot ranged from a high of $1,027.44 in Group 1 — the high-perishables stores — to $409.94 in Group 5, our supplement-focused retailers.
The nearly perfectly linear rise in sales-per-square-foot — as perishables increase, is why we organize the survey around fresh foods.
Sales Performance: 1% to 3% Average GrowthOverall, survey respondents reported 1.33% average growth for the 12 months ended June 30, 2017. Stores with perishables sales of at least 18% in Groups 1, 2 and 3, did best, with increases of 1.27% to 3.18%, while stores whose perishables sales were 7% or less saw slight declines of -0.13% to -0.30%, in Groups 4 and 5, respectively.
This seems to confirm that smaller vitamin and supplement-focused stores in Groups 4 and 5, which average 3,248 and 2,673 GLA-square-feet, respectively, aren’t as effective in attracting daily foot traffic as are larger, more food-focused natural retailers.
Also, as many survey respondents from stores of all types reported, online price competition for vitamin and supplement sales continues to be fierce.
Notice that stores in Groups 2 and 3, which average 33% and 18% perishables sales, respectively, also sell a significant amount of vitamins and supplements: representing 24% of sales for Group 2, and 40% of sales for Group 3. At an average of roughly 5,500 to 6,500 square feet, these mid-size stores seem to be offering enough variety in foods and supplements to convince customers it is worth the visit. (See Figure 3.)
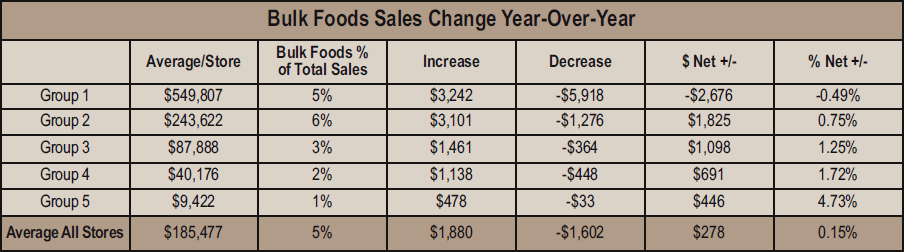
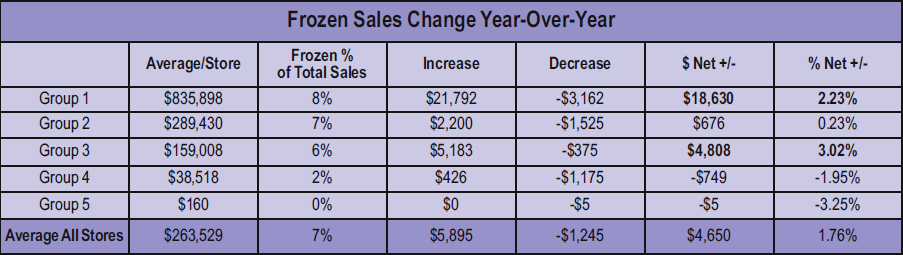
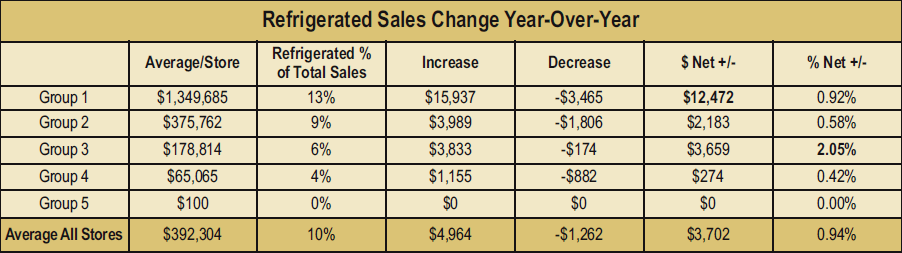
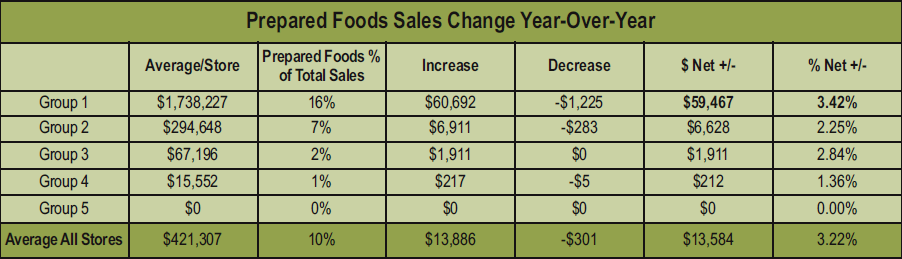
Sales by DepartmentWe asked survey respondents to tell us about their sales results in nine common product categories: supplements, personal care (HBA), dry grocery, refrigerated, frozen, fresh produce, prepared foods, bulk foods, and non-foods.
On average overall, supplements are the largest single department, at 23% of sales, followed by dry grocery, at 21%. Refrigerated, frozen, fresh produce and prepared foods run 10%, 7%, 12% and 10% each, respectively, and make up the 39% average “perishables” sales we observed in this year’s survey. Bulk foods and non-foods, which average 5% of sales each, are the two smallest departments.
Products That Led GrowthSurvey respondents told us product leaders that drove supplement sales included turmeric/curcumin, CBD oil and probiotics. Dry grocery continued to be dominated by gluten-free sweet and savory snacks, while kombucha got major play in the refrigerated case. No single product dominated the frozen food space, although ice cream substitutes and gluten-free offerings drew multiple mentions. Essential oils, collagen and soaps were rising fast in the HBA category.
Customers and TransactionsOverall, stores in our survey saw an average of 373 customers per day and sold $31.56 to each one. Again we see the direct link between customers per day and sales of fresh foods: as perishables sales increase, so do customer counts. (See Figure 4.)
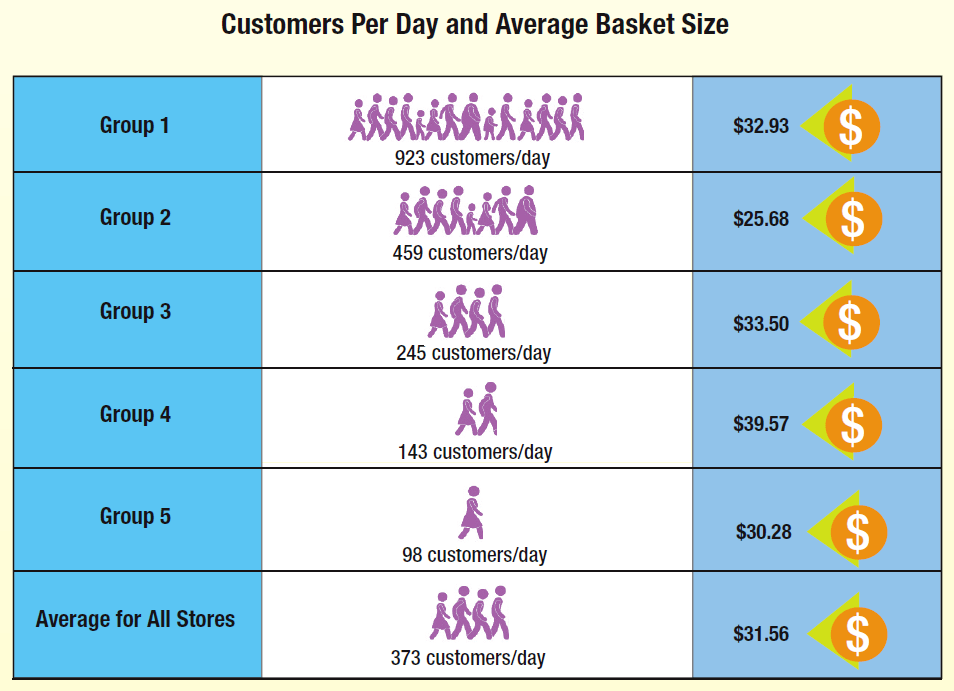
Stores in Group 4, with 63% average supplement sales and very few perishables, enjoyed the largest average basket size, at $39.57. Stores in Group 2, with 33% average perishables sales and 24% supplements, had the smallest average basket size, at $25.68.
Perhaps, with their convenient mid-size footprint, at 6,495 square feet, and just enough fresh foods to attract daily shoppers in search of meal solutions, Group 2 traded large average basket size for a high volume of customers coming through the door each day. Indeed, at 459 daily customers, Group 2 had triple the 143 customer count of Group 4, which gets just 7% of sales from fresh foods.
We asked survey respondents to tell us about their cost of goods (COGS) and gross profit margin (GPM) percentages of sales, which together always equal 100% of sales. (See Figure 5.) Stores also told us their wholesale and retail inventory values. (See Figure 6.)
Using this information, we measured annual inventory turns; how many times per year a store sells through its entire inventory value. Inventory turns is the most important measure of store efficiency: the higher the inventory turns per year, the more efficiently the store is using its space, and the better it is controlling its wholesale product purchasing budgets.
Costs of Goods and Gross Profit MarginsOverall, for all stores, cost of goods (COGS) were 61.25% of sales, and gross profit margins were 38.75% of sales. (See Figure 5.) This compares favorably with the 66% COGS and
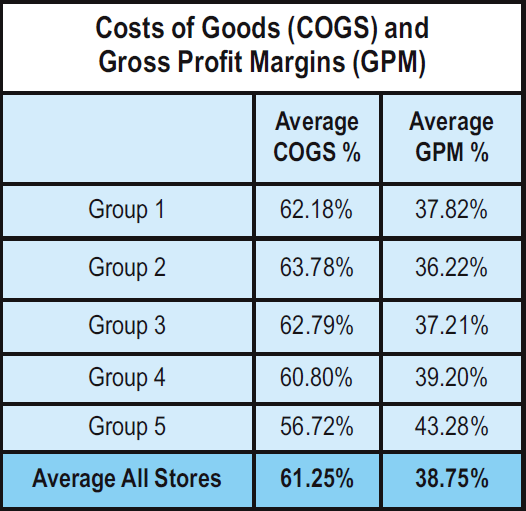
34% GPM of Whole Foods Market as of its last quarterly filing as a separate public company, on July 2, 2017. Independents appear to be successfully managing product costs and protecting selling prices and gross profit margins despite the heavy price competition from both brick-and-mortar and online competitors.
In general, the food-focused stores in Groups 1, 2 and 3 paid more for inventory as a percentage of sales than did vitamin and supplement-focused stores in Groups 4 and 5. The smallest vitamin stores had the lowest COGS, at 56.72%, and highest GPM, at 43.28%. Stores in Group 2 reported the highest average COGS, at 63.78%, and lowest GPM, at 36.22%.
Inventory Value and Annual Inventory TurnsOverall, for all stores, wholesale inventory values averaged $158,621, and retail inventory values averaged $258,963.
Looking at store efficiency, on average, survey respondents turned over their entire inventory values 15.58 times per year, or in just over three weeks’ time (23.4 days). Imagine, as we do, that stores typically have 30 days to pay for their wholesale purchases. On average then, stores in our survey enjoy an extra seven days to use their suppliers’ money before having to pay the invoice.
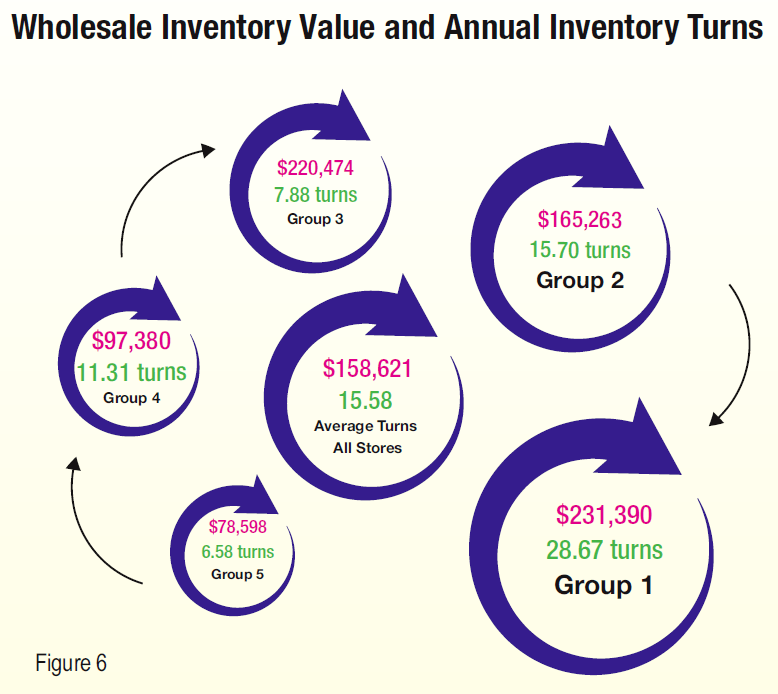
However, there are significant differences between fresh-food stores and vitamin-supplement retailers. Stores in Group 1, which sells the most fresh foods (55% of sales), turned their inventories over a whopping 28.67 times per year, or just under every 13 days.
At the other end of the efficiency spectrum, vitamin-supplement stores in Group 5 turned their inventories over just 6.58 times per year, or just under once every two months (55.5 days).
Group 4, stores that get 63% of sales from supplements and operate in 3,248 square feet GLA on average, appear to be more disciplined about vitamin purchasing budgets, turning inventory over almost once a month, or 11.31 times per year.
Mid-size stores in Group 3, with 18% perishables sales and 40% supplement sales, and operating in an average of 5,565 square feet, don’t appear to have as good a handle on inventory control; at 7.88 turns per year, or just under once every seven weeks (47.2 days).
The Bottom Line: Net ProfitsOverall, for all stores, net profits averaged $231,236, or 5.73% of net sales. Here we can clearly see the direct link between perishables, sales and net profits: as the percentage of perishables increases, so do net sales and net profits.
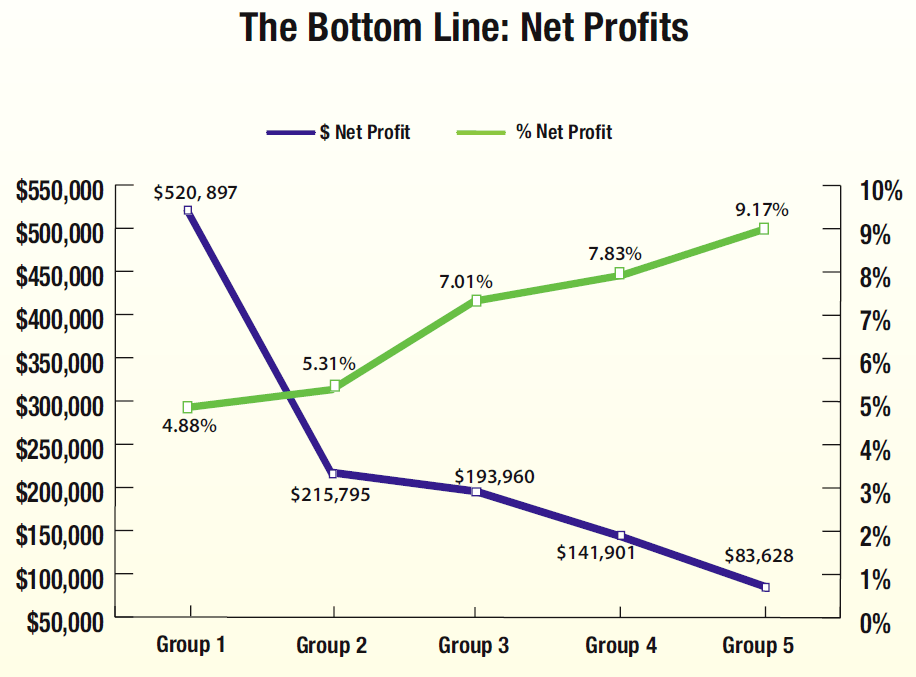
At the same time, net profits as a percentage of sales declines. So, while the largest food stores in Group 1 generate $520,897 in net profit, their percentage net profit is just 4.88%, while in Group 5, net profit averages just $83,628, but this represents 9.17% as a percentage of sales. (See Figure 7.)
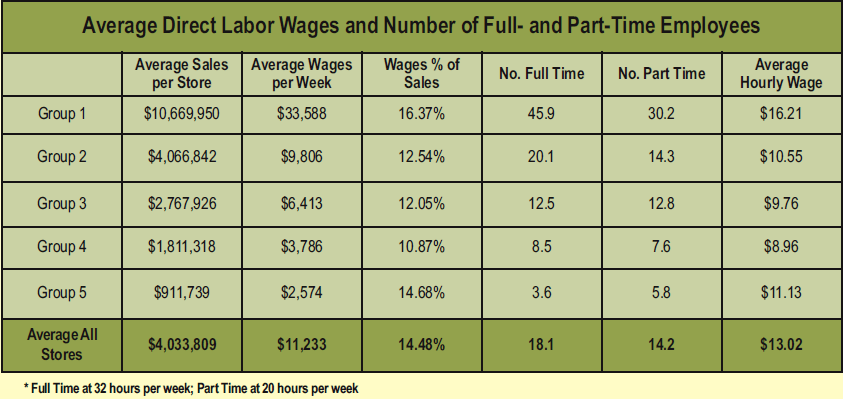
LaborOverall, stores had an average of 18.1 full-time (32 hours per week) employees and 14.2 part-timers (20 hours), each of whom earned an average hourly wage of $13.02. Wages for direct labor made up 14.48% of store sales on average. Again, there were large differences between food stores and vitamin stores.
Most stores in the survey — Groups 2 through 5 — paid employees about $9 to $11 per
hour. Stores in Group 1, our high-perishables group, paid significantly more than this: $16.21 per hour. This makes sense because of the professional skills needed to run kitchen, meat and fish, bakery and other complex fresh-foods departments.
In addition, we believe these hourly wage figures do not include employee benefits, so total direct labor compensation per hour may actually be higher.
Also, since these figures cover direct store labor — folks on the front lines, moving boxes and serving customers — total store compensation will actually be higher, once marketing, general and administrative back-office functions are included. (See figure below)
 RentWe asked independent retailers to tell us how much they spend on rent each month. (See Figure 8.)
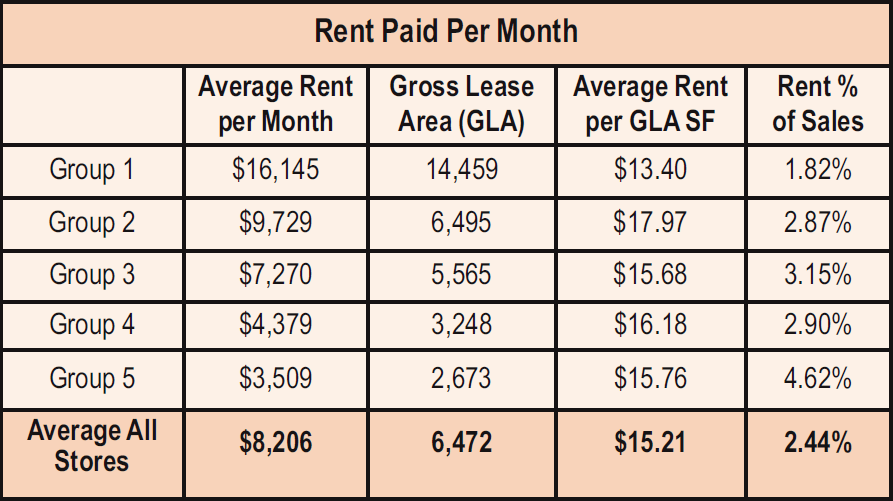
This year’s survey respondents paid an average of $8,206 in rent per month, equal to $15.21 per square foot, and 2.44% of sales. Notice that the largest stores, in Group 1 at $13.40 per square foot, appear to enjoy “anchor tenant” discounts on rent, where landlords lower lease rates to attract larger, high-traffic retailers to their properties that will benefit co-tenants.
While these rent percentages may seem surprisingly low, two important factors are likely at work. First, this year’s survey respondents were our most mature — and therefore very high-volume — stores in the history of our survey: under current ownership for 29.5 years, and 34.6 total years in business. Second, because of this length of time in business, stores in the survey may enjoy the benefits of favorable long-term leases at below-market rates.
MarketingRetailers told us how much they spent on marketing each month including radio, TV, direct mail, Yellow Pages, website(s), online advertising, social media, and in-store materials like lectures, newsletters and product sampling, and other miscellaneous marketing expenses. (See Figure 9.)
It may surprise, but spending for television advertising still tops the list of marketing expenditures, at an average of $2,187 per month for all stores.
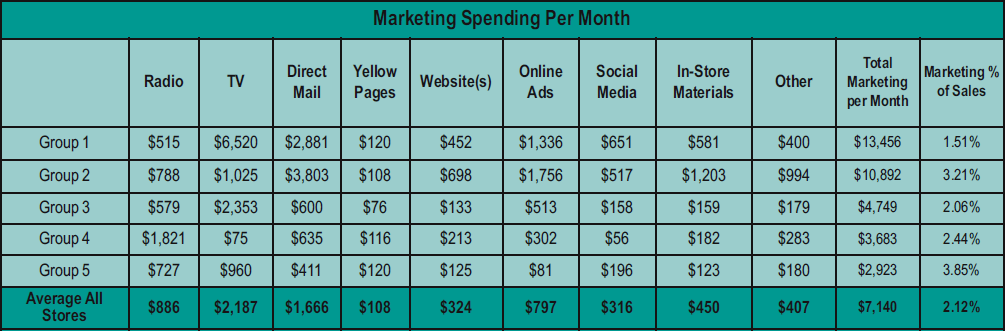
And, in what may be a clever strategy, retailers are spending heavily on direct mail, at $1,666 per month. This makes sense when you think about it: while online shoppers may never see your ad, shoppers will certainly pick up your printed piece from their mailbox.
Radio is the third-most common marketing tactic, at an average of $886 per month, with online advertising reaching fourth place, at $797. In-store materials, such as newsletters, also play a consistent role in store marketing, averaging $450 per month for all stores.
Overall, retailers spent an average of $7,140 on marketing each month, equal to 2.12% of sales, with most stores spending between 2% and 3% of total sales on marketing.
These percentages are significantly higher than previous surveys, and perhaps signal the current reality that independent natural organic retailers must do more than depend on good word of mouth to maintain and increase sales.
Online SalesThree out of four survey respondents (76%) did not sell any products online. About one in seven (14%) told us their online sales made up less than 5% of sales. Two percent of respondents got from 5% to 9% of sales online, three percent of respondents got between 10% and 19% of sales online, and three percent got up to 49% of sales online. One percent of respondents got between 50% and 99% of sales online, and one percent got 100% of sales online.
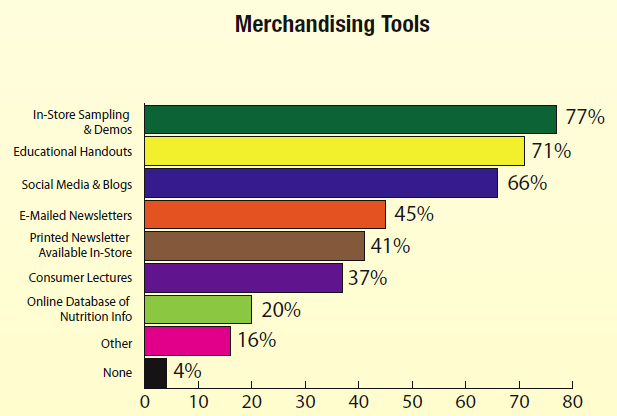
Merchandising ToolsIn-store product samplings and demonstrations are the most common merchandising tool retailers use (77%), followed by educational handouts (71%), social media and blogs (66%), emailed newsletters (45%), printed newsletters available in-store (41%), consumer lectures (37%), online database of nutritional information (20%), other merchandising methods (4%), and no merchandising efforts at all (4%). (See Figure 10.)
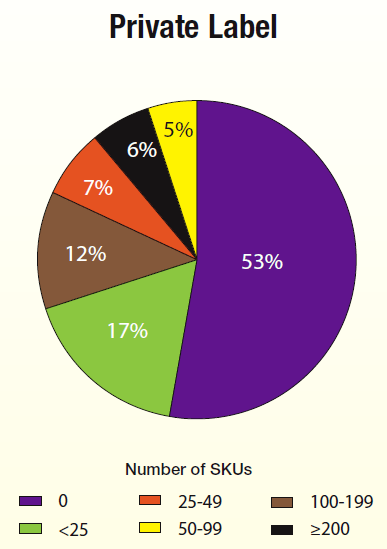
Private LabelNearly half of all respondents (47%) carry a private label supplement line, with anywhere from fewer than 25 stock-keeping-units (SKUs), to more than 200 SKUs. Several respondents said they carried 300 private label SKUs, two offered 500 SKUs, and one store had 1,000 private label SKUs. (See Figure 11.)
Sales ChangeIt was a good year for independents, with nearly three in four (74%) reporting a sales increase or stable sales.
Overall, about a third of retailers (32%) told us their sales
increased in the 12 months ended June 30, 2017. For most retailers (42%), sales remained about the same, and for about a quarter of respondents (26%), sales decreased.
For those retailers reporting a decrease in sales, the average decrease was 13%, and for stores that reported a sales increase, the average increase was 12%
Sales ForecastOur survey respondents are extremely optimistic about sales in the current year, with 96% expecting sales to increase or stay the same. More than half (56%) expect sales to remain stable, while 40% are anticipating sales will go up.
Retailers who told us they expect to grow, estimate their results in the current year will rise by 9%.
For the few retailers expecting a sales decline, 10% is the amount of the decrease they are anticipating; certainly not life-threatening.
Past Expansions and RemodelsOne in six respondents (16%) expanded or remodeled their space during the survey period, adding an average of 1,225 square feet, and spending $129,435, or $106 per square foot. The most common expansion (13% of those who expanded) was in the prepared foods department, including juice bar, café, deli, bakery, or grab-and-go cases. The same number of expanding retailers, 13%, also added space for refrigerated foods. Vitamins, herbs and supplements were the next most common expansion department, at 12% of those who expanded.
Personal, body care and cosmetics departments expanded in 10% of retailers making upgrades, with the same percentage (10%) choosing to expand the frozen foods area, and non-foods, household and pet departments. For fresh produce, 9% of expanding retailers increased this department, and 7% of expanding retailers enhanced their services and practitioner areas.
Future Expansions and RemodelsIn another sign of optimism, an even greater percentage of retailers, 21% this year vs. 16% last year, plan to expand or remodel their stores.
And, operators are becoming more aggressive, planning to add nearly four times the expansion area: 4,400 square feet planned this year vs. last year’s 1,225 square feet. In what may be wishful thinking, retailers with expansion plans expect to spend an average of $58 per square foot on the expansion, which is nearly half the $106 retailers actually spent on expansions and remodels last year.
Independents planning to expand appear to have their finger on the pulse of today’s consumer, with 15% of expanding retailers expecting to grow the prepared foods departments including juice bar, café, deli, bakery, or grab-and-go cases. Vitamins, herbs, and supplements, as well as personal, body care and cosmetics departments are in the expansion plans of 11% of expanding retailers. Refrigerated foods and dry groceries are slated to expand, with 10% of expanding retailers putting these two departments on the drawing board.
Fresh produce and dry bulk foods and bulk herbs departments will expand in 9% of all expansions, and frozen foods department and services and practitioner areas will grow in 8% of expansions. Non-foods, household and pet departments get the go-ahead in 6% of expansions, and 4% of expanding retailers will grow in other areas, such as the cash wrap, as well.
New StoresMost retailers in the survey (89%) have no plans to add a new store in the current year, but 9% of respondents intend to add one new store, 1% of respondents plan two new stores, and an additional 1% plan to launch three new stores.
Sales by Department and Year-Over-Year Change
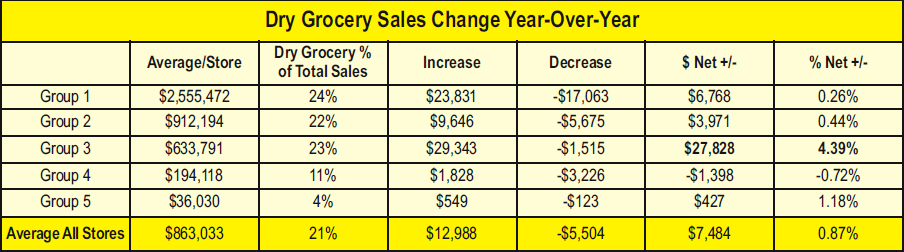
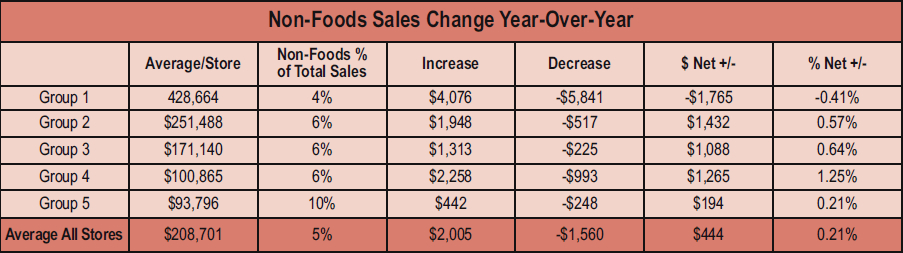

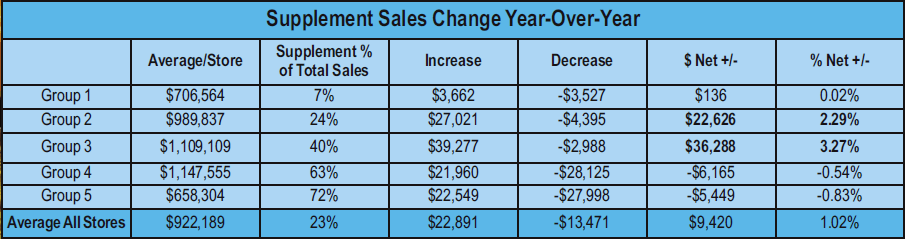
Overall, independent natural organic retailers managed to generate a 1.02% increase in supplement sales.

Perhaps consumers are seeing natural organic retailers as offering safer HBA personal care product ingredients than in other channels.
Retailer Voices
We asked retailers to tell us about other aspects of the business, including online competition and online plans, their most pressing problems, and prospects for future growth. The answers ran the gamut, but one common theme was the perception that Amazon continues to impact sales. Here is a sampling.• “[A wholesale distributor] is selling to [regional supermarket chain] and [mass marketer] at bigger discounts than they ever offered me. They have changed units of sale on food, so I cannot get a customer just one of something. This is driving people to the internet and Amazon, which is stealing a bit from us. It’s tough in retail!”
• “Online competition has been there for years. What has changed is the increased availability of organic and natural products at the local grocery and the big discount stores.”
• “Big chains are adding health foods to their lines providing more and more competition. The biggest hurdles are the customer attrition rate because of internet sales and finding staff that have interest or experience in the natural foods market.”
• “I feel the internet may end my small store unless I can raise funds to add a juice bar or something to draw customers in.”
• “I’m noticing more and more ads about products from Chinese companies are appearing on Amazon sites.”
• “It’s difficult to find help! Most [job applicants] don’t want to do what it takes to work in retail – long hours, cleaning, stocking, etc., and few have experience in natural food, supplement stores.”
• “Having put emphasis on the baby boomers and not the millennials has been a successful business model. A large percentage of our profits come from supplements/HBA and herbs (65%), and most of the store’s growth came from first-to-market items such as bone broth and plant-based proteins, and those primary customers had disposable income. Millennials don’t spend the monies on those categories in our store or they buy online and go where it is a sociable event – like 365, Whole Foods, or stores with food and wine service.”
• “Partnering with our vendors, suppliers and brokers has allowed us to be in line with their goals and affords us opportunities based on performance and volume. Large format stores such as Whole Foods, Lucky’s, Fresh Thyme and Sprouts are making it difficult to compete and to grow sales with needed margin returns. Acquisitions of vendors, chain stores and businesses by investment groups and by companies like Amazon put pressure on the core business by erosion of customer visits and limits the relationships with said vendors due to management restructuring. Stores must be prepared to focus on their core competencies and review and change business models that are limiting growth and customer perceived value.”
• “In the end it is up to the independents to be profitable and survive and the industry will do the same.”
Thank you to all who responded and congratulations to Susan Lyon, owner, Cornucopia Natural Foods, Galesburg, IL, winner of the $100 American Express gift card. WF
2018 Retail Insights® Retail Universe for Premium Natural, Organic Food, Supplement & Personal Care Sales Natural Organic Sales Grow 5.1% in 2017 – Reach 12.2% of U.S. Food Store Sales
By Jay Jacobowitz
What a tumultuous year in the food business! On April 10, 2017, activist investor Jana Partners announces an 8.8% stake in Whole Foods Market and pressures the retailer to sell after a long string of declines in quarterly same-store sales; a key retail metric. Before the end of that month, the company enters into a non-disclosure agreement with Amazon, and the two announce their deal by mid-June.Conventional Grocers Under PressureWhile the Amazon-Whole Foods deal was the most high-profile disruption of the year to U.S. grocery, conventional food retailers were already struggling with changing consumer shopping behavior; buying online and expecting rapid home delivery, or to be able to pick up at grocers’ “drive-through.” Convenience-seeking households were embracing meal-kit subscriptions, robbing conventional grocers of shopping visits and growth. Scrambling to adapt, major grocers were slowing store expansions and shifting investment to technology to keep up with the changes in demand.
Add to all this, price deflation in important categories such as dairy, meat, and poultry, which put downward pressure on already-thin profit margins, and risked triggering a price war. To top it all off, non-traditional hard discounters Aldi and Lidl, were in rapid expansion mode, forcing grocers in their markets to lower prices further.
Between deflation, grocery sales escaping to the internet, and competition from non-traditional discount channels, the 37,886 conventional grocers we track annually in the Retail Insights’ Retail Universe actually lost $2.58 billion in sales, or about four-tenths of one percent (-0.4%), to end 2017 at $647.87 billion, down from $650.46 billion in 2016. But natural organic sales continued to grow.
Results for Eight Retail ChannelsThis year’s Retail Universe tracked calendar year 2017 natural organic sales through 111,939 stores in eight retail channels including club stores such as BJ’s, Costco and Sam’s Club; drugstore chains CVS, Rite Aid, Walgreens, and independent druggists; mass merchants Target and Walmart; conventional supermarkets including Kroger, Publix, Safeway, Wegmans and others; supernatural retailers Fresh Thyme, Sprouts Farmers Markets, Whole Foods Market and others; vitamin chain stores GNC and Vitamin Shoppe; “compact” grocers — those stores under 20,000 square feet — including Trader Joe’s and Natural Grocers by Vitamin Cottage; and independent natural retailers and coops. (Please see the 2018 Retail Universe table below.)
 Overall, these grocers and nutritional retailers added $3.854 billion in natural organic sales, to reach $79.061 billion in 2017 from $75.206 billion in 2016; a 5.1% increase. This represents a 12.2% share of the $647.8 billion in total food store sales. Nearly one out of every eight retail grocery dollars now buys something natural or organic.
By now, it should surprise no one that natural organic foods continue to outpace inflation and the growth rate of conventional foods. Consumers are redefining quality in food, buying fewer and fewer highly processed foods, and more and more natural and organic foods. As a result, well over 100,000 U.S. retail stores now offer some meaningful assortment of natural and organic products. (Note: Some totals may not foot due to rounding.)
Natural Market ShareHow did our $79 billion in natural sales break out by channel? Well, as you might expect, supernaturals including Earth Fare, Fresh Thyme, Sprouts Farmers Markets, Whole Foods Market and others maintained their number one position, adding $1.52 billion to total $23.5 billion, for an industry-leading 29.75% natural market share. Compared to 2016, supernaturals grew by 97 stores and added 2.167 million square feet, as most of these big natural players built new stores.
In second place, by virtue of their sheer large number of stores — 37,886 — conventional supermarkets boosted their natural organic sales by $1.77 billion, to $15.459 billion, grabbing a 19.55% natural market share, and securing the number two spot.
At 6,561 stores, independent natural retailers and coops lost a net 13 stores in 2017 (minus two-tenths of one percent, -0.2%), but average store size increased by 4%, to 3,712 square feet gross lease area, up from 3,563 square feet in 2016. And sales for independents grew by $458.1 million, to $11.481 billion from $11.023 billion in 2016, capturing a third-place 14.52% natural market share. For an in-depth look at the independent natural sector, please see the just-released "2018 40th Annual WholeFoods Magazine Retailer Survey", beginning on page 38 of this issue. As you’ll read in the Survey, independent natural retailers continue to make themselves relevant to quality-seeking shoppers, are optimistic about the current year, and have ambitious expansion plans.
Close on the heels of independents, in fourth place, are what the Retail Universe calls “compact” grocers—those retailers whose stores are no larger than 20,000 square feet; a little less than half the size of a typical 45,000-square-foot conventional supermarket. This group includes a couple of key players: Natural Grocers by Vitamin Cottage and Trader Joe’s, among others. In 2017, compact grocers sold $11.4 billion, up $336 million from $11.064 billion in 2016; reaching a 14.42% natural market share.
Next up, in a distant fifth place, mass merchandisers Target and Walmart, secured a 6.46% natural market share, adding $216 million in sales, to $5.107 billion, up from $4.891 billion in 2016.
In sixth place, club stores BJ’s, Costco and Sam’s Club, reached a 6.08% natural market share, adding $221 million to $4.807 billion in sales, up from $4.585 billion in 2016. Overall, even though Costco added stores, the club channel lost 25 stores (-1.85%), as Sam’s Club opened 13 stores in 2017, but in January of 2018 announced the closure of 63 stores, for a net loss of 50 stores. We reflect the new, lower total of 597 Sam’s Club stores in the 2018 Retail Universe.
The pharmacy channel struggled in 2017, shrinking by 201 stores (-0.33%), and shedding $6.2 million in natural sales, to $3.841 billion, and ending in seventh place with a 4.86% natural market share.
Vitamin Chains Hit HardVitamin chain stores had the roughest year of all eight retail channels we follow in the Retail Universe. The channel was plagued by chronic negative quarterly comparable-store sales comparisons for most of the year. After a multi-year struggle, Vitamin World declared bankruptcy in September, 2017, ultimately closing 265 stores, leaving just 156 units open. GNC also reduced the number of corporate and franchise stores by 87. Even though Vitamin Shoppe added 33 units, overall, the vitamin chain channel lost a net 319 stores, or 5.45% of its store base, and shrank by $665.8 million in sales, a loss of (-16.2%). The channel closed 2017 with $3.441 billion in sales, for a 4.35% natural market share, eighth place out of the eight channels we track in the Retail Universe.
Perhaps the challenges we are seeing in the vitamin chain channel; difficulty maintaining customer counts, is similar to what we found in this year’s Retailer Survey (beginning on page 38), where stores that sold mostly supplements and few foods also experienced sales declines.
Natural MilestonesSquare footage dedicated to selling natural organic products reached 135.8 million square feet in 2017, or 4.32% of the total 3.147 billion square feet gross lease area of the 111,939 stores the Retail Universe tracked this year. This means that natural organic products — which now make up 12.2% of all food store sales — are nearly three times as efficient per-square-foot as all products sold at retail.
Total natural square feet in service in 2017 increased by 4,281,800 square feet, to total 135.8 million square feet, up 3.3% from the 131.5 million natural square feet in 2016. This compares nicely to the 5.1% increase in 2017 natural organic sales, and suggests that natural retailers are not overbuilding their stores. At 2.16 million new square feet, the supernatural channel added almost exactly as much as the 2.11 million new square feet in all seven of the other retail channels.
For all 111,939 retail stores, the average space dedicated to natural organic products is 1,214 square feet, with average annual sales of $706,288 per store, and $582 per gross-lease-area square foot; all record highs as measured by the Retail Universe.
Online SalesAs online sales continue to grow, retailers are beginning to report their online sales as a percentage of total revenues. For 2017, GNC generated an estimated $221.9 million in online sales, and Vitamin Shoppe captured $126.8 million in sales direct to consumer. The Retail Universe takes these online nutritional sales into account.
Among other retailers, Kroger, which owns the nutritional supplement website, Vitacost, also has significant natural sales through this online portal. Walmart and Target, while not breaking out online nutritional sales are likely significant players, with $9.5 billion and $3.0 billion in overall online sales, respectively, for all product categories offered by these two mass merchants. And last, but most certainly not least, Amazon, with its massive in-house and third-party online market, may be the biggest nutritional online player. Perhaps Mr. Bezos will share that number with us one of these days.JJ
Jay Jacobowitz is president and founder of Retail
 Insights®, a professional consulting service for natural products retailers established in 1998, and creator of Natural Insights for Well Being®, a holistic consumer marketing service designed especially for independent natural products retailers. With 40 years of wholesale and retail industry experience, Jay has assisted in developing over 1,000 successful natural products retail stores in the U.S. and abraod. Jay is a popular author, educator, and speaker, and is the merchandising editor of WholeFoods Magazine, for which he writes Merchandising Insights and Tip of the Month. Jay also serves the Natural Products Association in several capacities. Jay can be reached at (800)328-0855 or via e-mail at jay@retailinsights.com.
Laurie Petersen is editor-in-chief of WholeFoods Magazine. She has more than 20 years of digital media and marketing operations experience and has covered the retail industry for Brandweek, DIRECT, MediaPost, Econsultancy, Aol and other national media outlets.
 Laurie is a member of the Journalism and Women Symposium and an adjunct professor in digital marketing innovation for the Fox School of Business at Temple University. She can be reached at 908-769-1160, ext. 216 or lauriepetersen@wfcinc.com