
By Jay Jacobowitz and Maggie Jaqua Sponsored by: Nutrasource
Most importantly: How are you? This year, the first question in our annual retailer survey was a simple invitation to sound off on pressing matters, to help industry members see beyond the numbers, and hear straight from you, the independent natural products retailer, about the past year. As one retailer noted, these are historical times in life, in retail, and in business in general. Another summed up how many are feeling: “Overall blessed to continue to serve our community, but it has been challenging. Primary concern is safety of staff and customers, yet supply chain disruptions have created the biggest challenge. Most of our customers have remained loyal, but unfortunately we have lost some to online shopping too.”In this survey, we’re going to look at the data, and also hear from retailers, in their own words, on how it really looks and feels inside the store. And for the brands, suppliers, distributors, and associations reading this, independents have some messages for you, too, on how you can help support the brick-and-mortar stores that helped build the natural products industry. As one respondent reminds the industry: “Small brick-and-mortars have paved the way for these companies to sell their products.”
Some important background to keep in mind regarding the survey results: The annual survey is like sampling a glass of vintage cabernet sauvignon. Each year, we taste from a different vineyard—the different group of respondents that participates in the survey each year. We also ask each year’s group of respondents to tell us about their own prior year’s results—like sampling two vintages from the same vineyard. This yields our same-store results that you’ll see on pages 32-33.
So how did the retailers who responded to our survey fare as the pandemic continued to impact operations? Net profits, which were 5.02% in last year’s survey, did take a hit, declining nearly two percentage points (-1.97) to 3.05% this year. That said, given all the pressures independent natural organic retailers faced in the last half of 2020 and in the first half of 2021, surviving profitably is a significant achievement. We’ll dive deeper into the various impacts over the course of this survey.
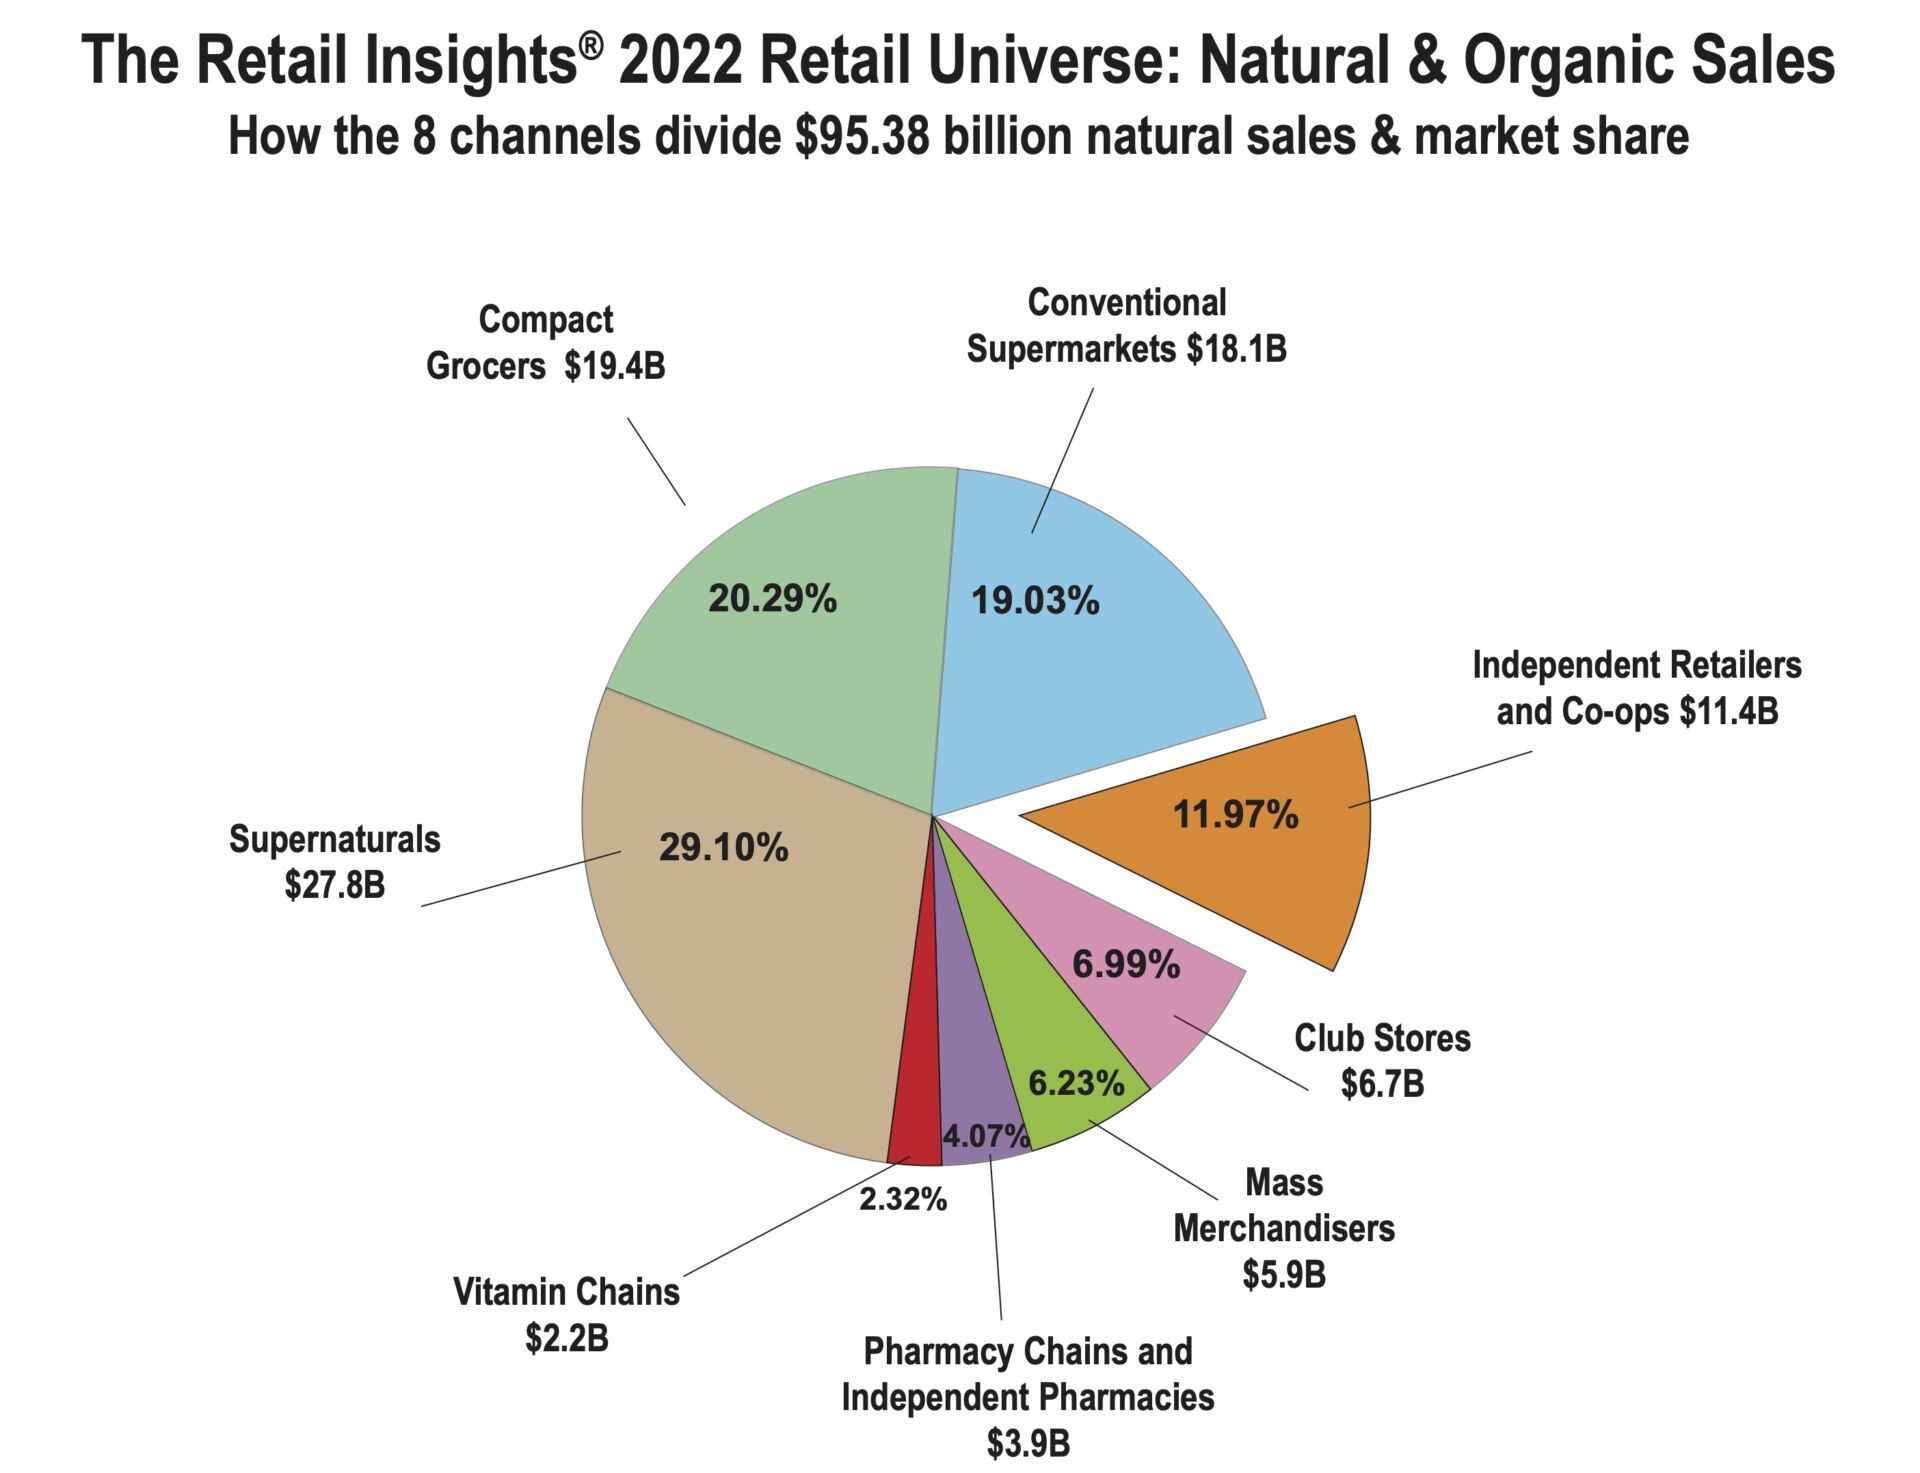
Taking a wider view of our industry, sales from all U.S. independent natural retailers hit $11.4 billion in 2021. Zooming out further, total natural organic sales through all eight retail and food-store channels (including supernaturals such as Amazon Whole Foods Market and Sprouts Farmers Market; conventional supermarkets; mass merchandisers; pharmacies; and vitamin chain stores) was $95.38 billion in 2021 (see below). For a complete update of the U.S. natural organic retail market, see the Retail Insights® 2022 Retail Universe for U.S. Premium Natural, Organic Food, Supplement & Personal Care Sales on pages 34-35.
 Now, let’s zoom back in…way in, and look at the detailed findings that can help you see how your store stacks up, and provide you with insights that can help you strengthen your business. Questions? Send them to editor@wfcinc.com. We'll be discussing key findings and answering your questions in a virtual presentation, which, along with this year’s survey, is sponsored by Nutrasource Pharmaceutical and Nutraceutical Services. Stay tuned for details!
Respondents at a Glance
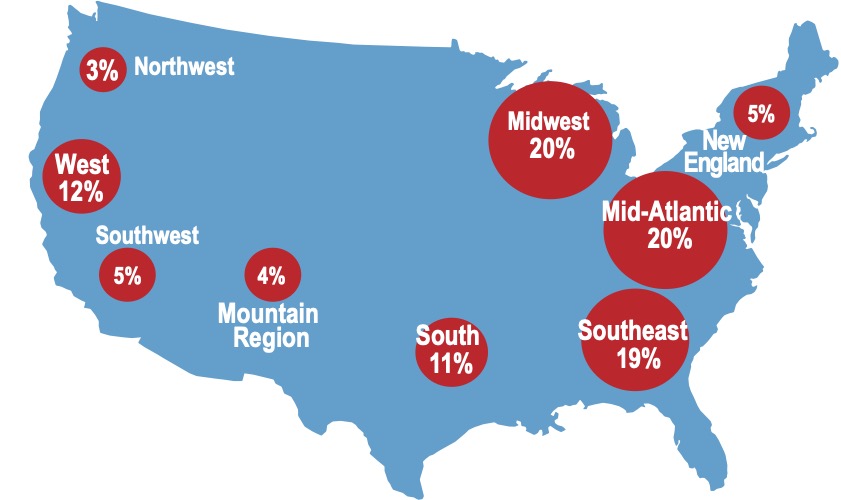
Once again this year, WholeFoods partnered with Readex Research to survey independent natural organic retailers, gathering results for the 12 months ending in June 2021. To the many retailers who participated in this year’s survey: Thank you. We appreciate how busy you are and we are grateful for your thoughtful responses, which help us provide what we believe is the most accurate picture of independent natural products retailing in the U.S. today. This survey is used by natural products retailers to measure and improve business, as well as to inform natural products industry partners, and we would not have been able to do this for the past 44 years without you.As in previous years, respondents to this year’s survey come from every region of the country (see figure 1), and represent every size market (see below), giving us an in-depth picture of the industry.
41% Large town or rural area (population less than 50,000)
22% Medium city or suburb (population 100,000 - 299,999)
16% Major metropolitan area (population 1,000,000+)
12% Small city (population 50,000 - 99,999)
10% Large city or suburb (population 300,000 - 999,999)
Respondent fast facts:
89% are natural organic retailers, co-ops, supermarkets, or limited natural assortment retailers, such as herbs, personal care, and natural pharmacy
11% are retailing practitioners, doctors, or wellness centers carrying natural organic inventory
77% operate 1 store
11% operate 2 stores
6% operate 3-6 stores
6% operate 7+ stores
26 years is how long respondents have owned their stores, on average (and stores in the survey have been in business for an average of 32 years under all ownership)
59% rent their space; 41% own the real estate
70% are store owners, CEOs, or presidents
30% are general or store managers, company officials, or other store employees
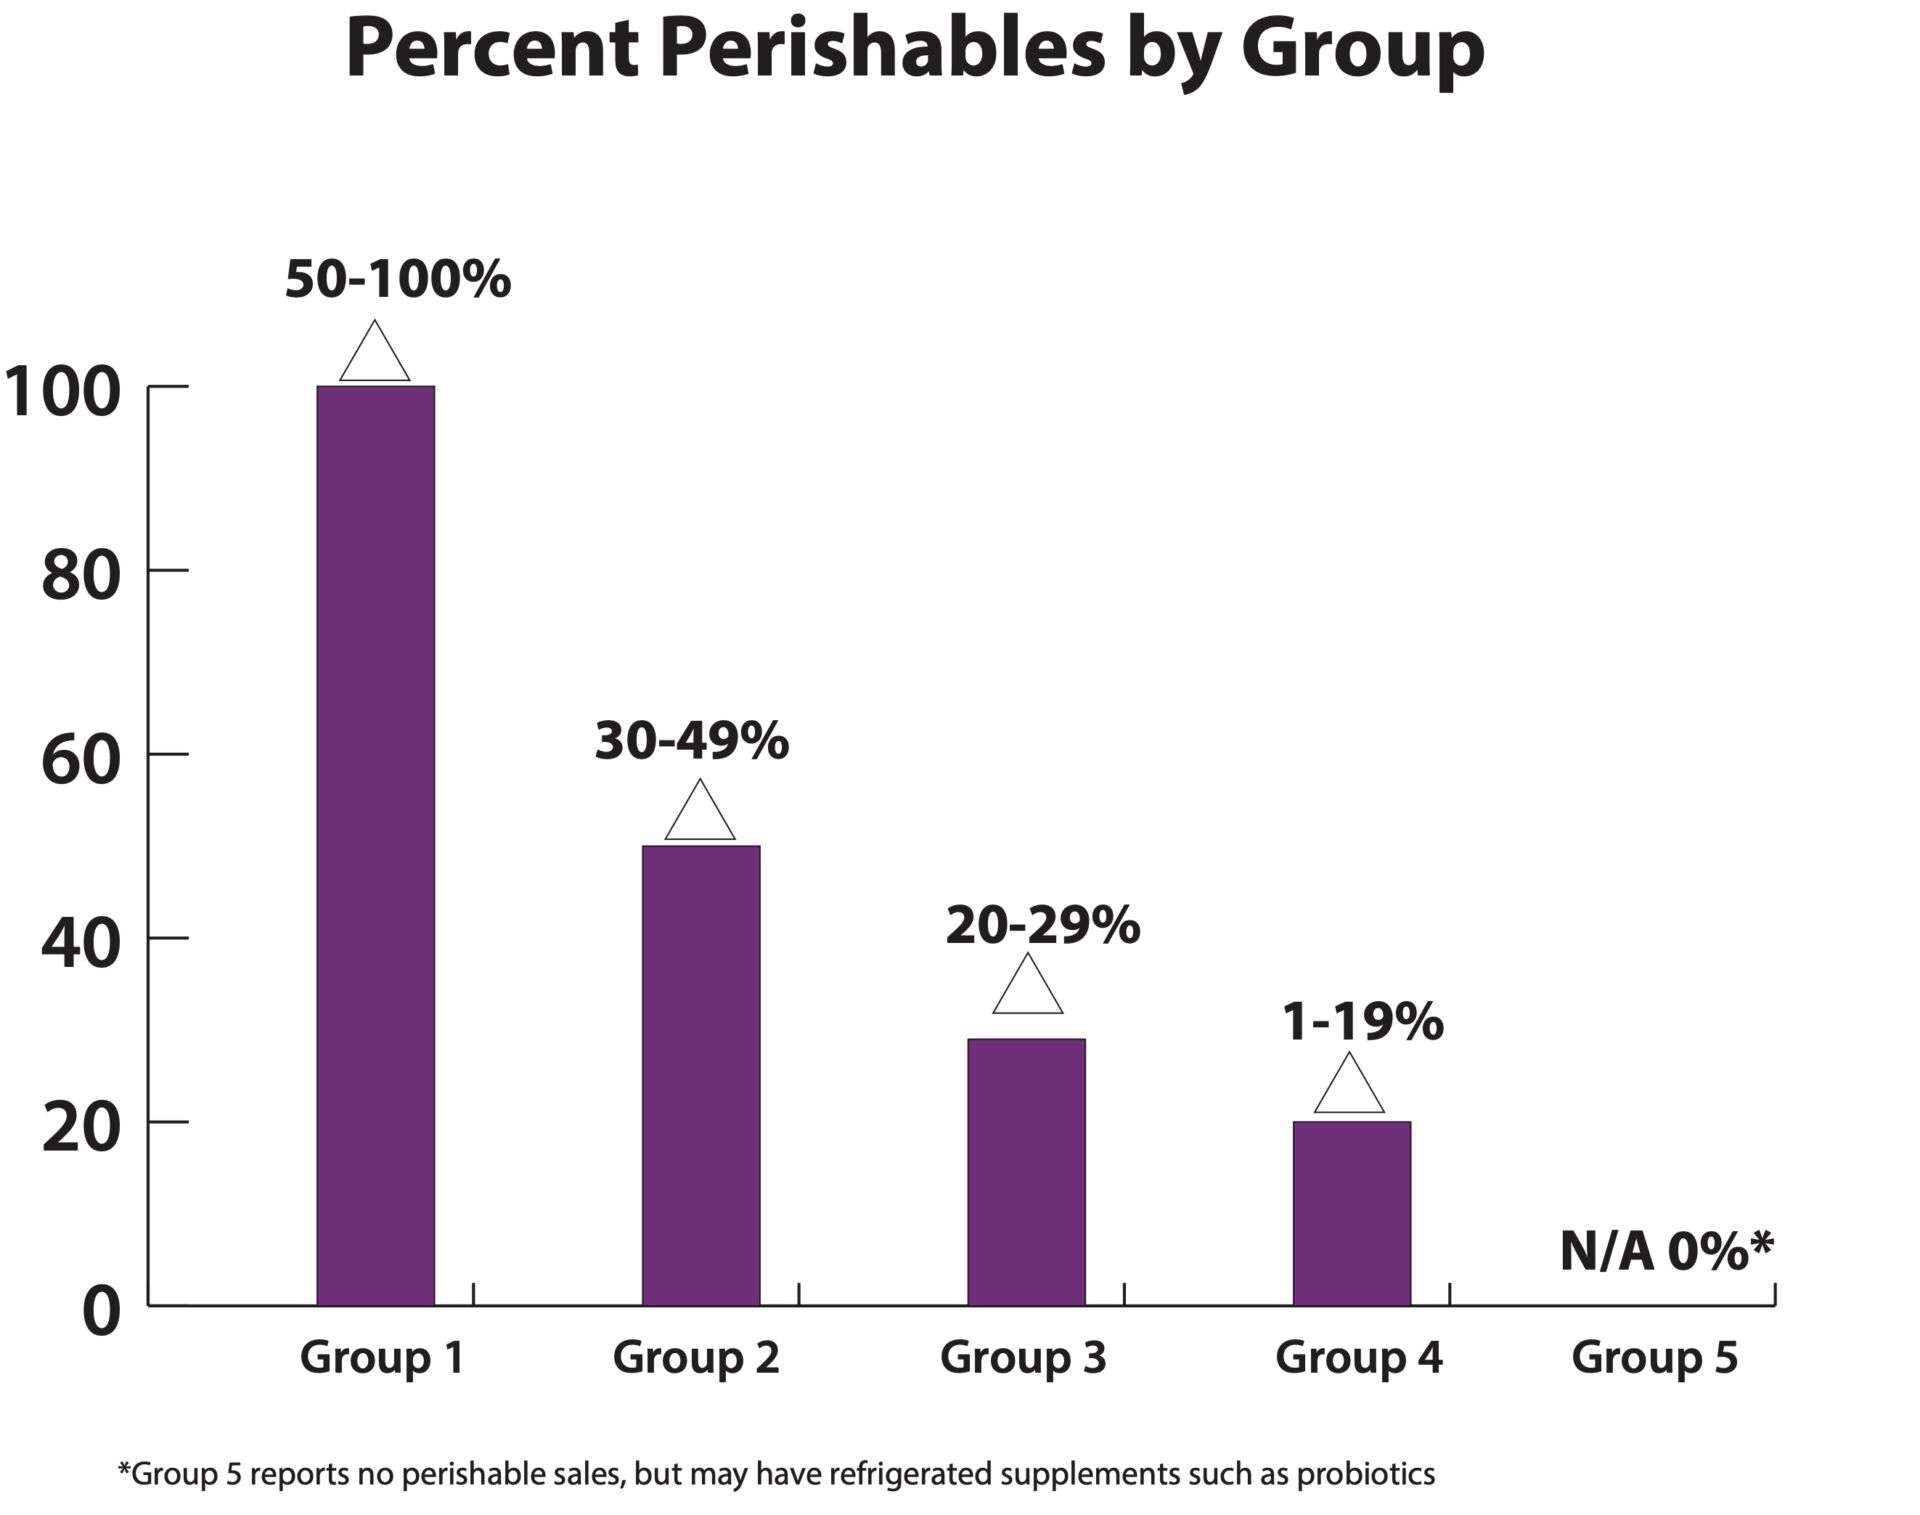
Retailers: Get the Most Out of This Survey
A key point to know when reading this survey: Perishables largely determine how large a store will be, and the sales it achieves. A store in Group 5, which sells no perishables, looks nothing like a store in Group 1, which offers a wide selection of perishables (think a Whole Foods Market). When using the data from this survey, you want to compare your results to the results of stores in your group. Which group are you? Find out in three steps:Step 1: Tally up your sales from four main perishable fresh-foods departments: refrigerated, frozen, produce, and prepared foods.
Step 2: Calculate what percentage of your total sales these four categories represent.
Step 3: Compare your results to similar stores in your corresponding Group—either Group 1, 2, 3, 4, or 5.
Fresh Perishable Foods Define the Store
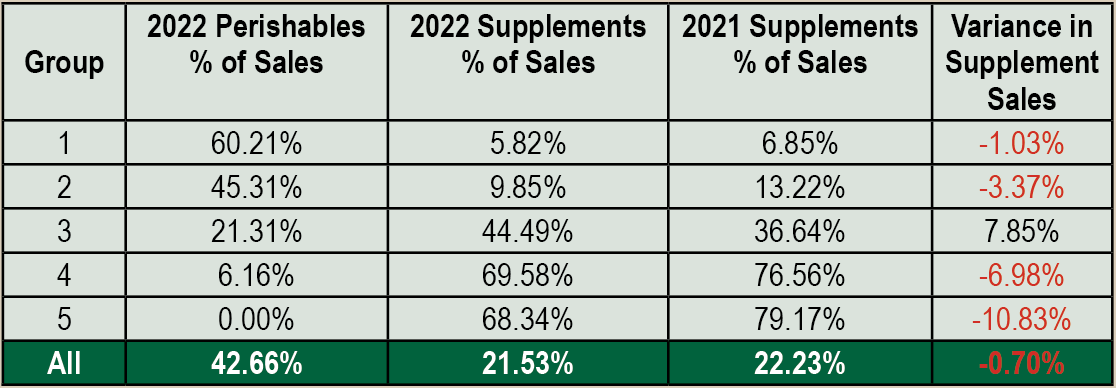
Even with the changing group of independents who respond year-to-year, the finding that perishables determine a store’s size and sales remains constant. (See Figures 2 and 3). In this year’s survey, the major perishables stores in Groups 1 and 2 increased their fresh sales, but stores in Groups 3 and 4 reduced fresh foods significantly. In particular, stores in Group 4 last year averaged 11.05% perishables sales, but cut their fresh foods this year by 4.89 percentage points, or by nearly half (-44%), averaging just 6.16% of sales this year. Because of the exit from fresh foods in these smaller stores this year, we combined last year’s Groups 4 and 5 into a single Group 4, giving this year’s survey a total of five groups instead of six.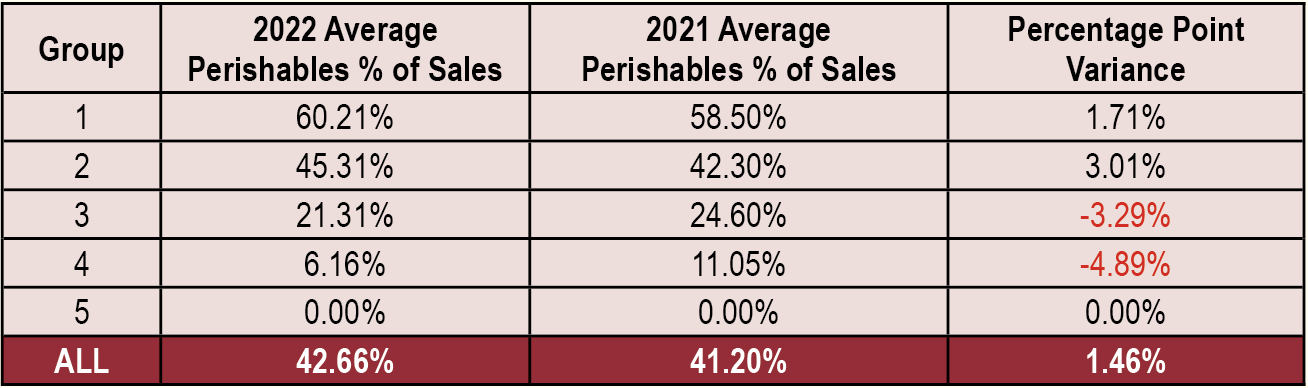
High Perishable Stores; High Supplement Stores
The independent natural organic retail sector has a split personality: Stores that sell a lot of fresh foods sell a small percentage of supplements, and stores selling lots of vitamins sell almost no fresh foods. Supplements sales went down as a percentage of sales this year vs. last in four of our five groups. This does not mean overall sales went down. Average sales for all stores in the survey were $2,303,946 this year vs. $2,218,053 last year. Independents sold relatively more dry groceries, personal care, household and other products, which explains the year-over-year decrease in the percentage of supplement sales. Groups 4 and 5 sold fewer supplements compared to last year, but that is perhaps because they are larger stores with more room for practitioner areas, non-perishable foods, non-foods, household and pet products this year.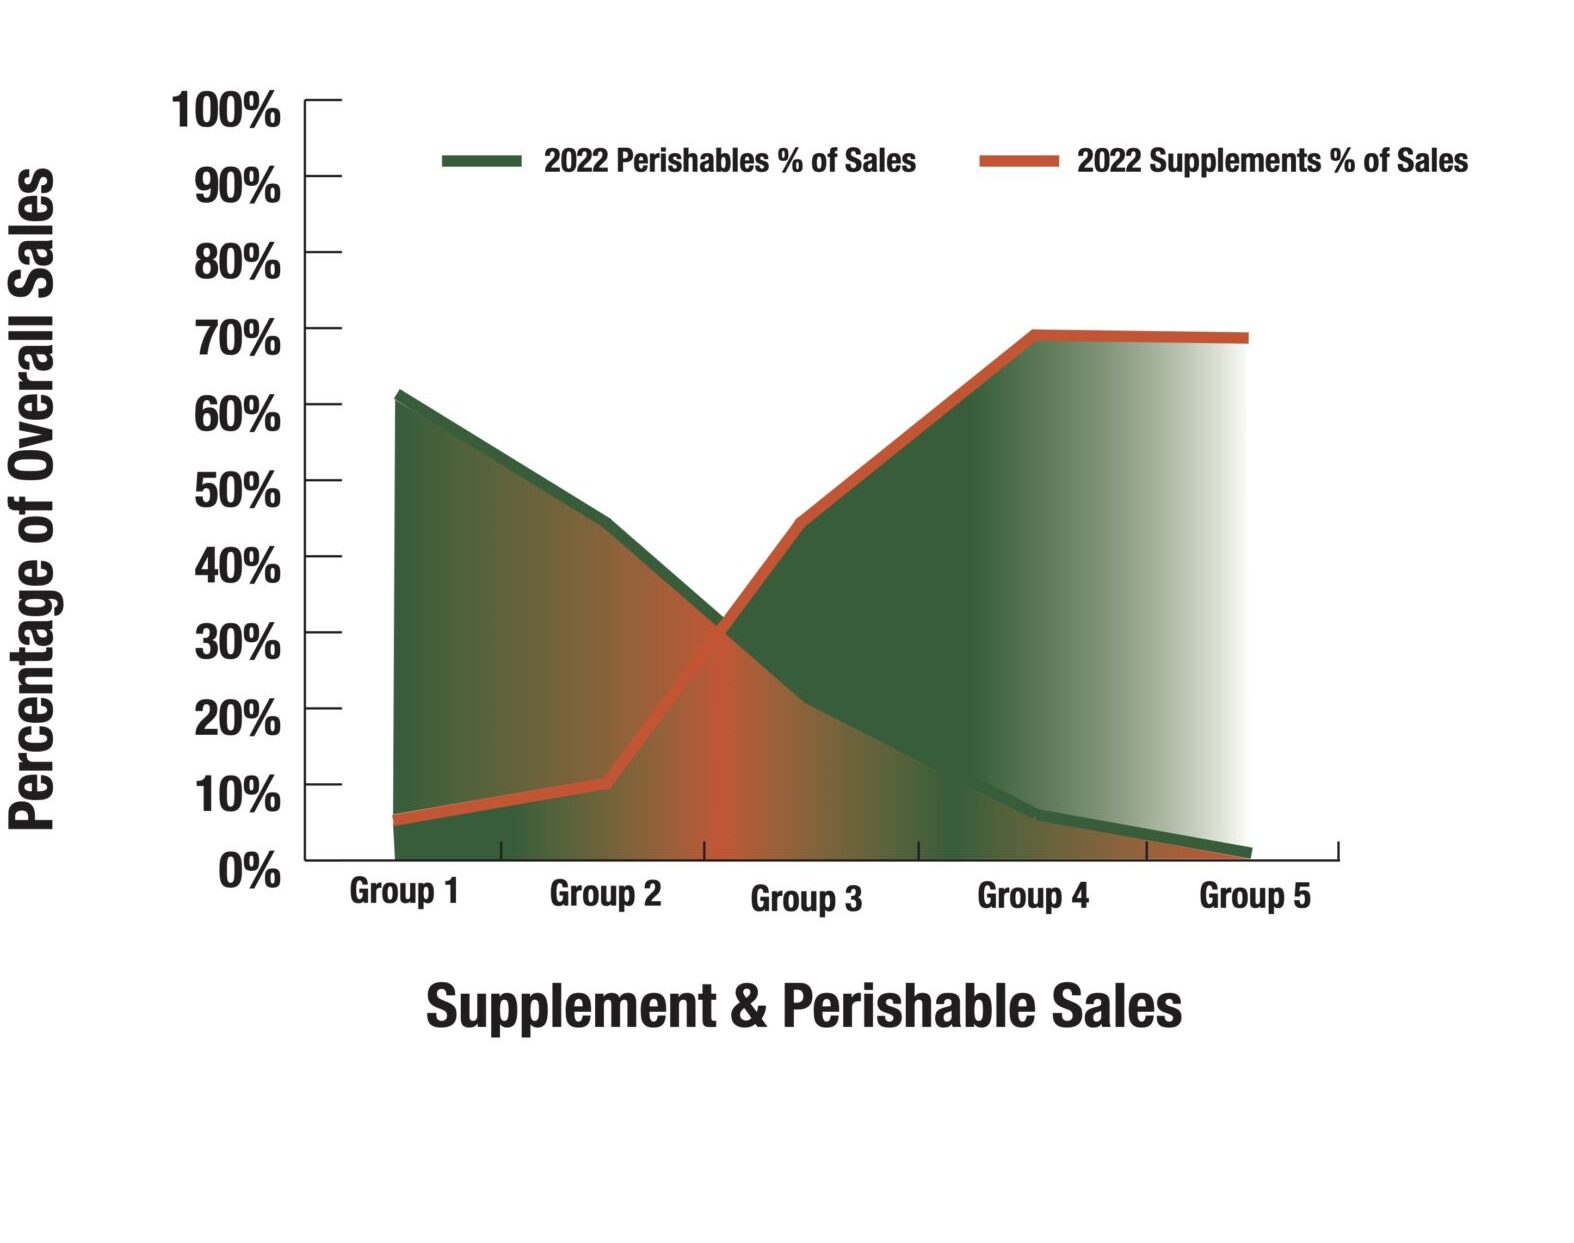
Pro Forma Profit & Loss
Despite the infamous “supply chain” bottlenecks, stores in the survey saw cost-of-goods rise modestly this year to an average 63.99% from 63.16% last year, less than one percentage point (0.83). For this, credit natural industry suppliers who stepped up with promotional product allowances to help maintain retail sales levels as the pandemic ripped through the economy. Gross profit margins shrank by the same 0.83 percentage point, to 36.01% this year from 36.84% last year. Labor costs increased more than did cost of goods, due to pandemic hazard pay, increased minimum-wage pressure, and lower workforce participation rates, rising 1.41 percentage points to 19.93% overall this year from 18.52% last year. Rents were nearly unchanged, likely due to many long-term leases with predetermined per-square-foot costs. Remember, stores in the survey have operated for an average 32 years, allowing sales to rise to mature levels, helping keep rents low as a percentage of sales. A store opening today would not expect to enjoy such low rent as a percentage of sales. Marketing expenses stayed relatively stable, at 0.92% this year, compared to last year’s 1.02%. Altogether, these changes did impact net profits, which declined to 3.05% this year from 5.02% last year. Given all the pressures independents faced in the period of the survey, surviving profitably is a great achievement. We believe this bodes well for independents’ future as the country emerges from the pandemic.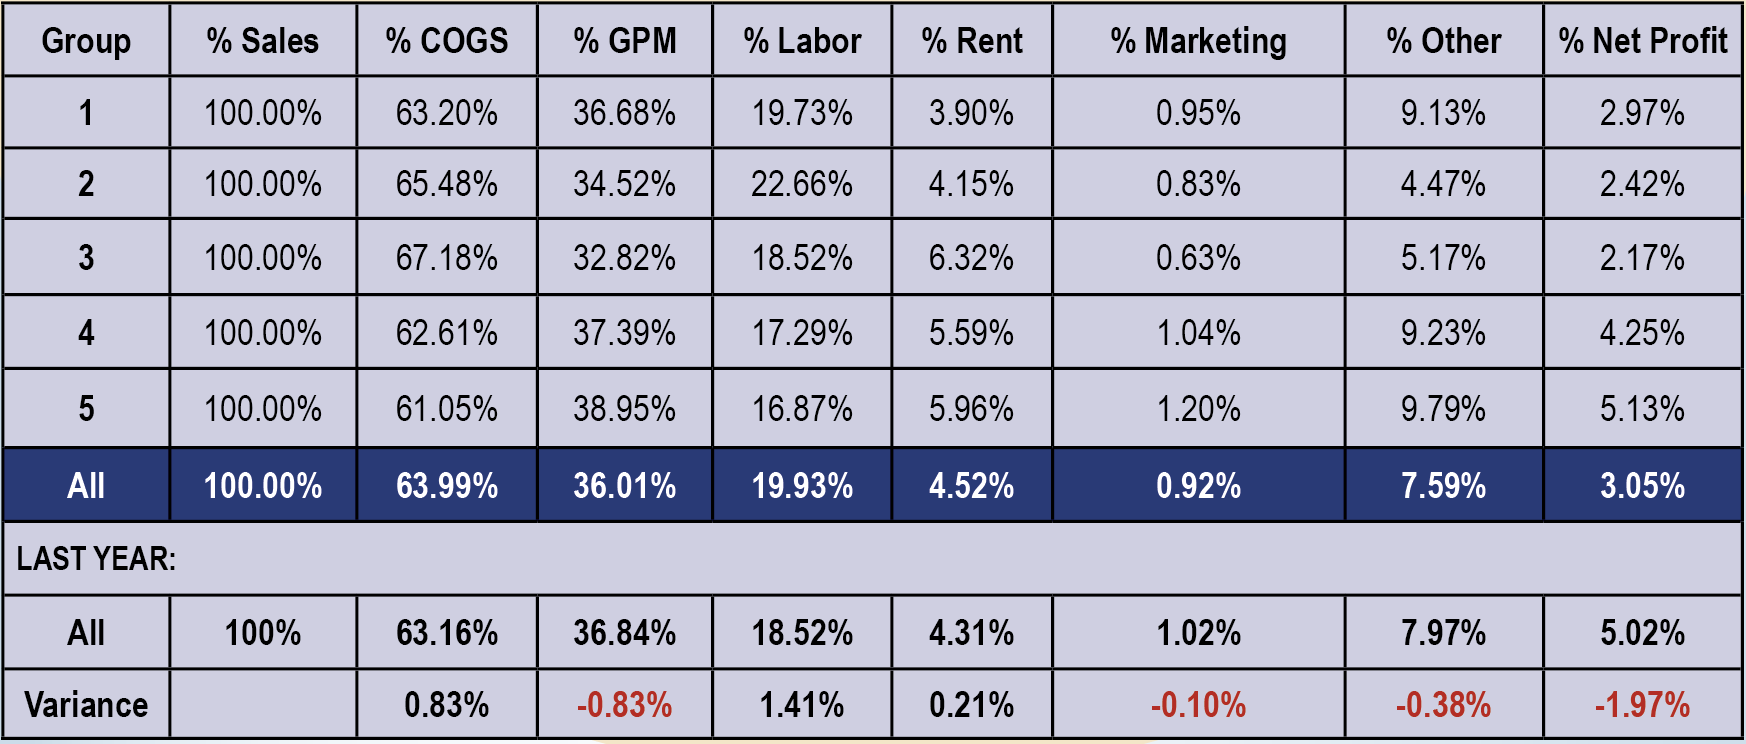
GLA: Small Stores Size Up % Change vs. 2021 Survey Respondents
Looking at gross lease area (GLA), stores in Group 2 were smaller this year, while Groups 3, 4 and 5 all were larger.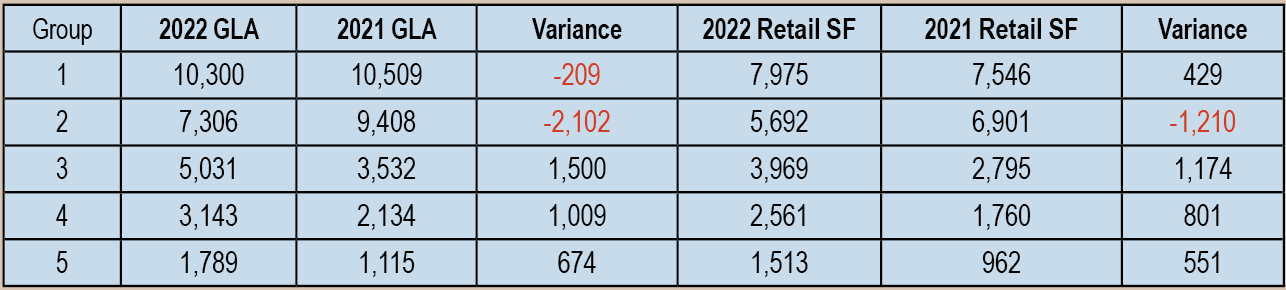
2022 vs. 2021 Total Sales & Annual Sales Per GLA Square Foot
Sales per gross-lease-area (GLA) square foot decreased compared to last year, mostly due to increases in the average store size of this year’s survey respondents.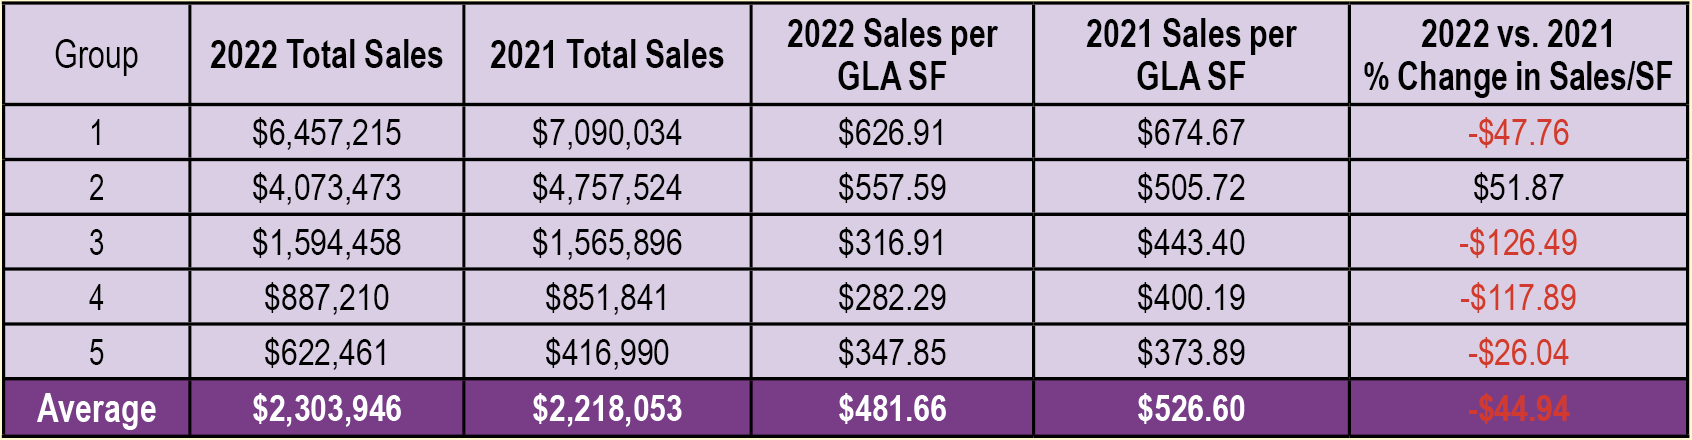
Shopping and Spending
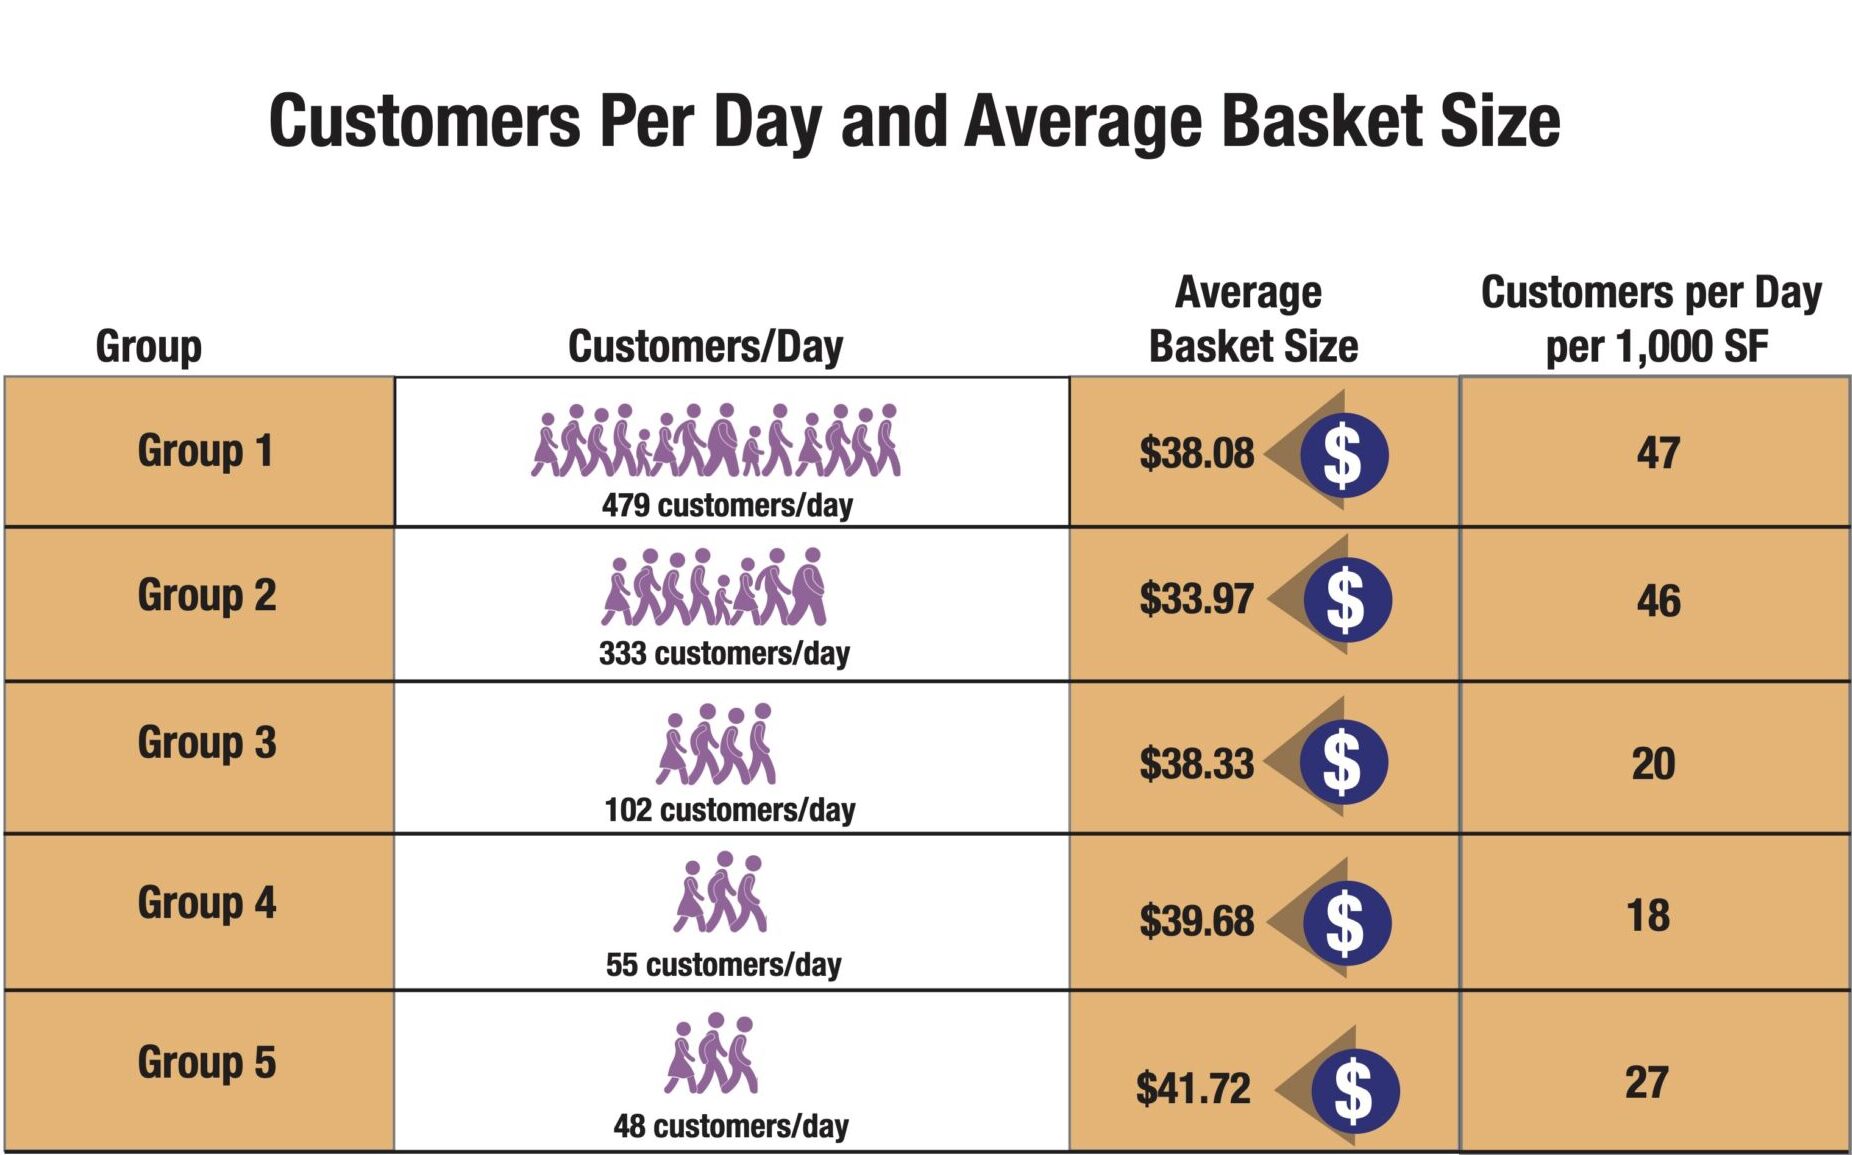
Shoppers are loading up their baskets (see Figure 8), though COVID-times saw more shoppers heading online, first out of necessity, and then out of convenience. Did independents meet them there? In this year’s survey, most respondents (65%) did not do e-commerce. Of those who did, 21% generated 9% or less from e-commerce sales. Another 6% got from 10% to 49% of sales from e-commerce, and 8% generated from 50% to 99% of sales from e-commerce. Regarding the consumer preference for online, one retailer told us, “Our store always gave personal service and information. We always used books such as Prescription for Nutritional Healing. The public has no idea what they are missing by relying only on the internet.”Online or not, independents are there for their communities: 58% are open seven days a week; 42% are open six days.
Stocking Shelves (or at least trying to)
The supply chain challenges that took root at the beginning of the pandemic were a top concern during the survey period, and many respondents mentioned the difficulty of keeping shelves stocked. One told us: “Every company that supplies us supplements is having trouble with out of stocks, thereby impacting sales.” Zinc, vitamin C, D3, and NAC were cited as in-demand, and tough to keep in-stock.As the pandemic drags on, supply chain concerns are increasing. One respondent worried that “the COVID supply chain issues may be the final straw. We are getting an average of 1/3 to half of what we order from almost every supplier.”
A retailer who has owned the store for 33 years said he has never experienced anything like this, and noted problems with supplements as well as staple foods, frozen and refrigerated items. “Knowing that the norm is usually 2-3% for out of stock as the industry standard, this time around we are seeing the pipeline is drying up...and now we can feel this true ripple effect. This is very troubling, as well as scary.”
Adding to the concern: “Most customers now shop online; inventory is hard to get efficiently with long ship times, [and] manufacturers cater to web accounts not brick and mortar, giving deeper discounts so competing is almost impossible,” one respondent pointed out. “Manufacturers ignore this.”
Minimum advertised price (MAP) came up again, with one retailer lamenting, “Some well-known companies in this industry have sent us letters stating we will pay more for the product but the MAP and suggested retail price (SRP) are staying the same so you will have a lower margin. I am dropping those companies as they don’t have my best interest in mind. And remember: All companies started by going to small independents and after we have gotten them on the map we get slapped and are told we are no longer worth the effort to carry their product as they go off to follow the money trail regardless who they leave in their path. Capitalism isn’t compassionate.”
Not all companies are doing business like that, though. The same retailer continued: “At the same time, I see reputable companies not allowing small independents to be undercut by other sellers or their pricing online. These are the companies we are doing business with.”
Another retailer outlined the large scope of the problem and issued a call to action: “The most impactful issue that I feel our industry faces right now is large corporate takeovers that remove the human quotient from our business and even more troubling is the lack of inventory and shipments from our existing vendors. Massive out of stocks, short shipments, and a general apathy from those distributors with the ‘It’s COVID’ response is increasingly disturbing. As a small business we must order just in time to keep cash flow and operational funding available. [Doing so] requires our vendor partners to do what they are supposed to do and provide their product (that we are paying for) to us in a timely fashion. I realize that the golden goose is MFD [the Mass, Food, and Drug channel] to some of these companies but when turns and margin are not what is expected, MFD will drop them quickly and who will they turn to in order to refill their coffers? The little mom and pop that got them started, but sadly with their current attitude there may be no more of us left. In closing, we do not need help in Washington about DSHEA restrictions; we have been working through this for 33 years and have developed strategies to combat it on the front line. What we do need is for the larger organizations to bring pressure to bear on the vendors, distributors and others to reduce minimum order and shipping quantities and amounts, ramp up production, get their packaging materials from wherever they can to put the product to market.”
In terms of what’s selling, independents told us about their sales results in nine product categories: dry grocery, refrigerated foods, frozen foods, fresh produce, prepared foods, bulk foods, non-foods, dietary supplements and personal care (HABA). See page 32 for the breakdown. We also asked what products had the greatest impact on the store’s sales. As expected, immune-related products topped the list. One respondent shared, “We’ve seen big shifts in what our top sellers are. Of course it’s the immune SKUs—quercetin, zinc, vitamin C, vitamin D, things like that. Last year elderberry and herbs were the things we sold out of quickly when lockdowns were happening, now it’s more nutritional supplements.”
Increased Options for Shopping & Delivery
Since the start of the pandemic, there has been a vast increase in online ordering, so we expanded this year’s survey to capture the full variety of delivery solutions stores have devised to accommodate customers’ desire for convenience and safety.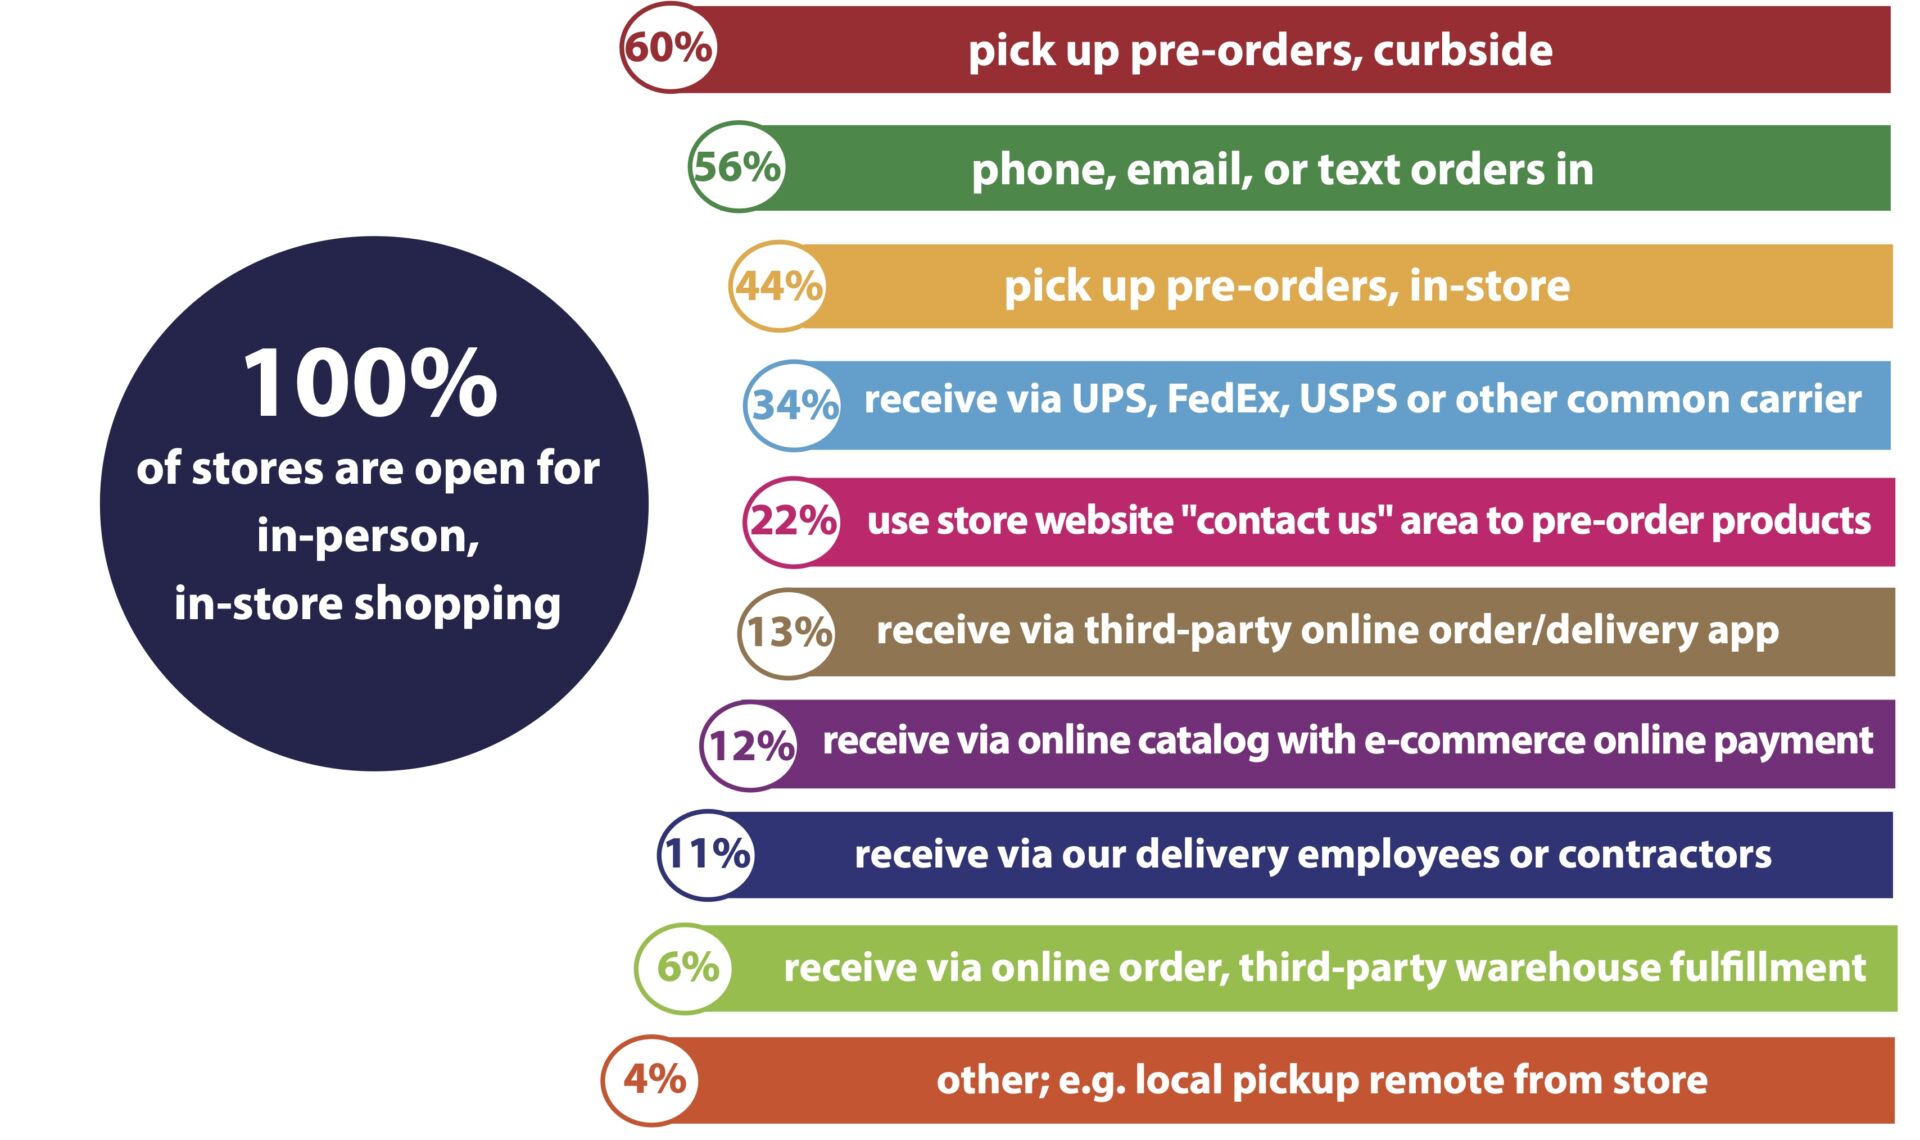
Average Annual Sales per Square Foot
We report sales-per-square foot for the total store (Gross Lease Area, or GLA), as well as for the retail-selling area alone, which excludes the non-retail back-room support areas.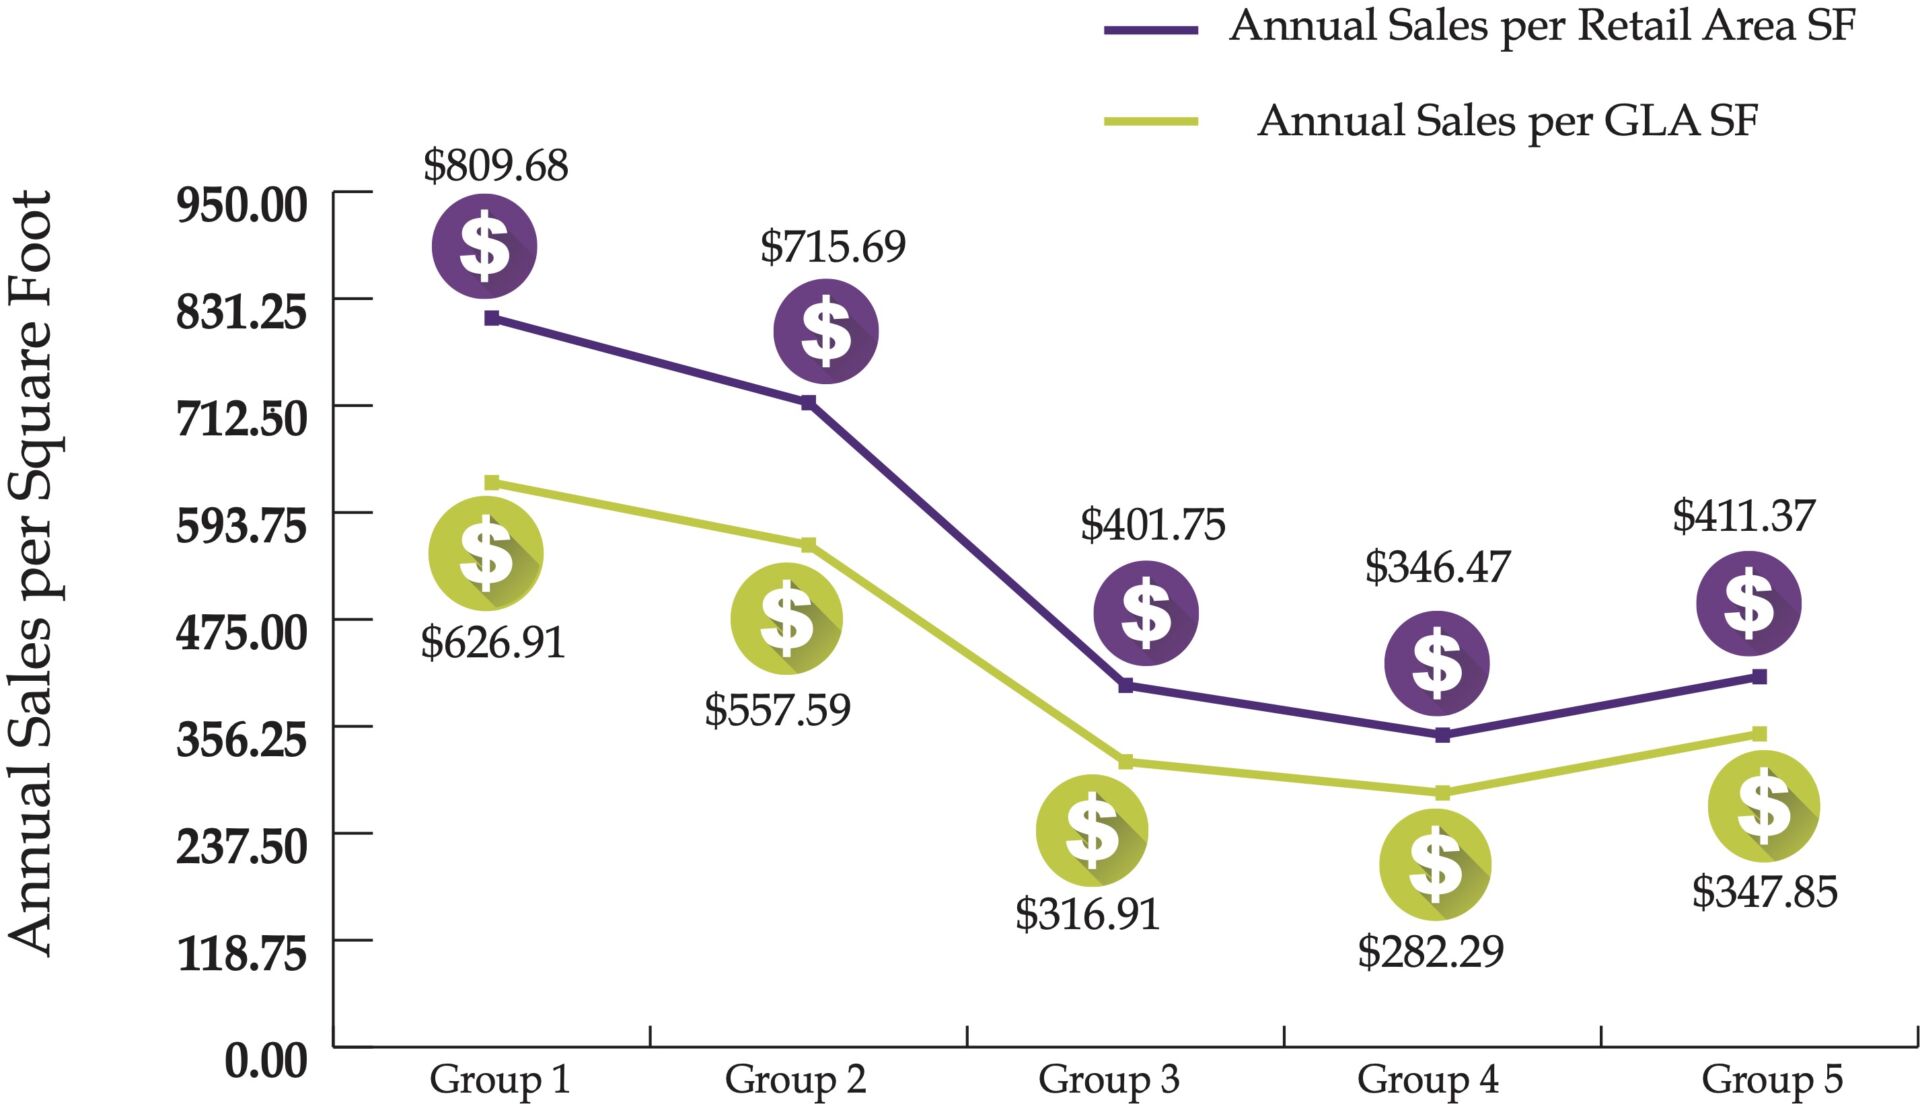
Retail & Wholesale Inventory Value & Annual Inventory Turns
The more foods you sell, the faster you turn your inventory over, as seen with Group 1’s 17.91 annual inventory turns compared to Group 5’s 4.92.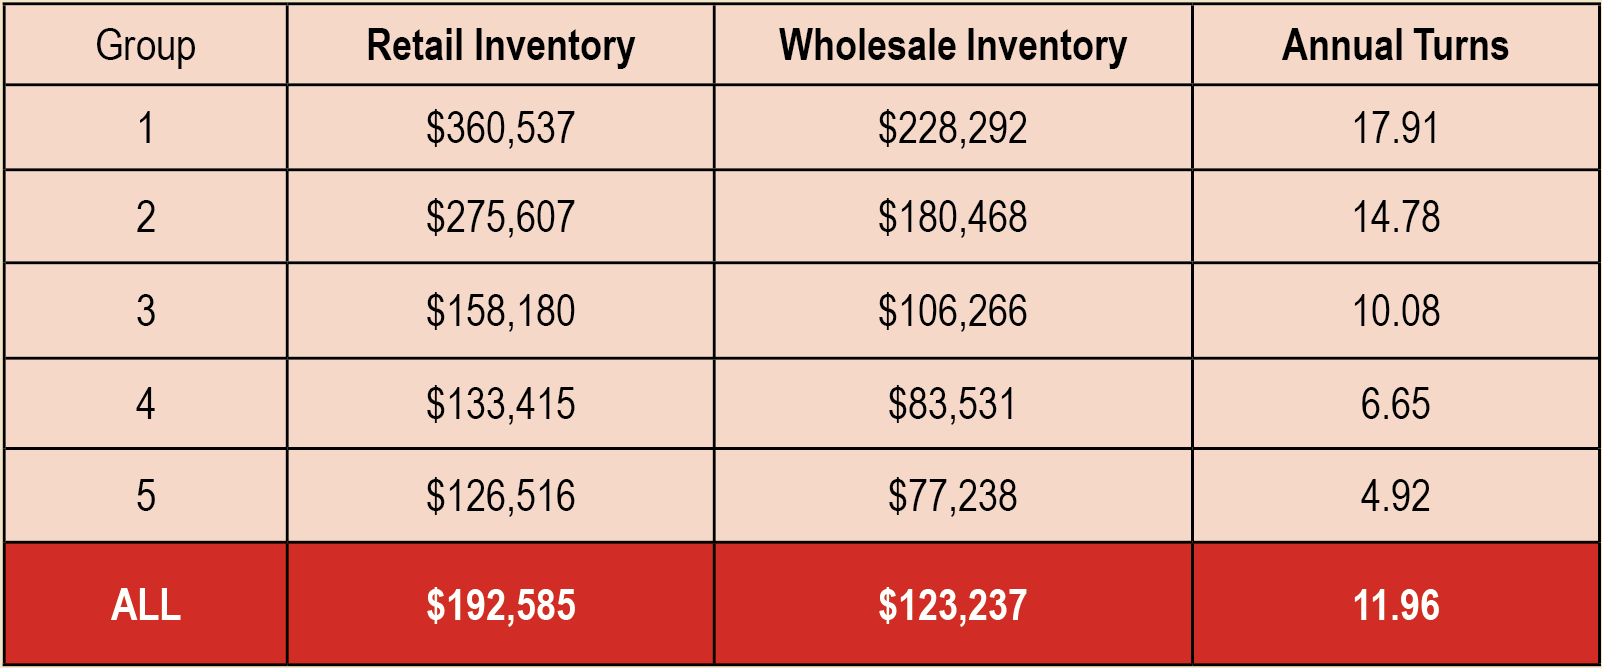
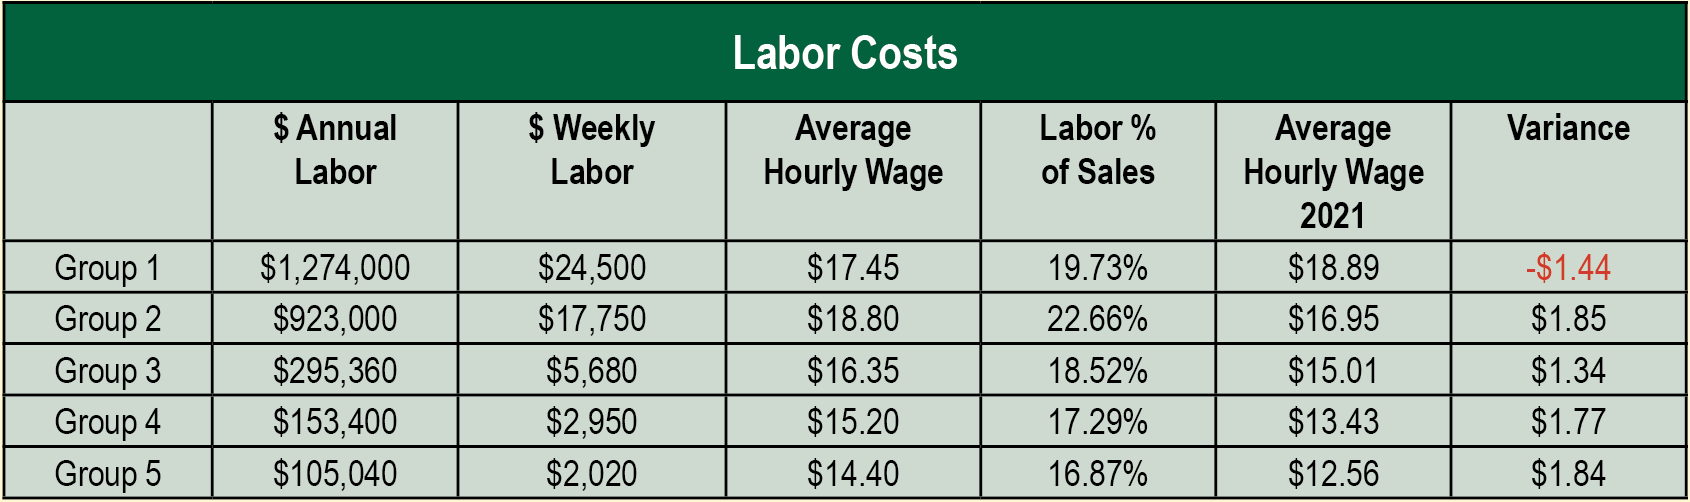
Investing in Employees
Employee retention was especially challenging during the survey period. One short-staffed respondent told us, “Along with having to raise our prices to an all-time high, we have had to change hours, and close departments for one day a week to not overwork the few workers we have.” Another shared: “PPP [Paycheck Protection Plan] was a lifesaver. We paid our team more and reinvested some of the saved cash on store/equipment upgrades. With COVID and staff exposure, we had to reduce our hours, but kept open.”Looking at the numbers, in four out of five groups (Groups 2, 3, 4 and 5), wages per hour rose vs. last year by an average of $1.70 per hour, as we would expect from the pandemic. The one exception is Group 1, which saw wages per hour decrease by $1.44, to $17.45 from $18.89 last year. We believe this is due to the different mix of stores that responded to this year’s survey, a number of which operated more than seven stores, suggesting tighter controls on compensation. (See Figure 12.)
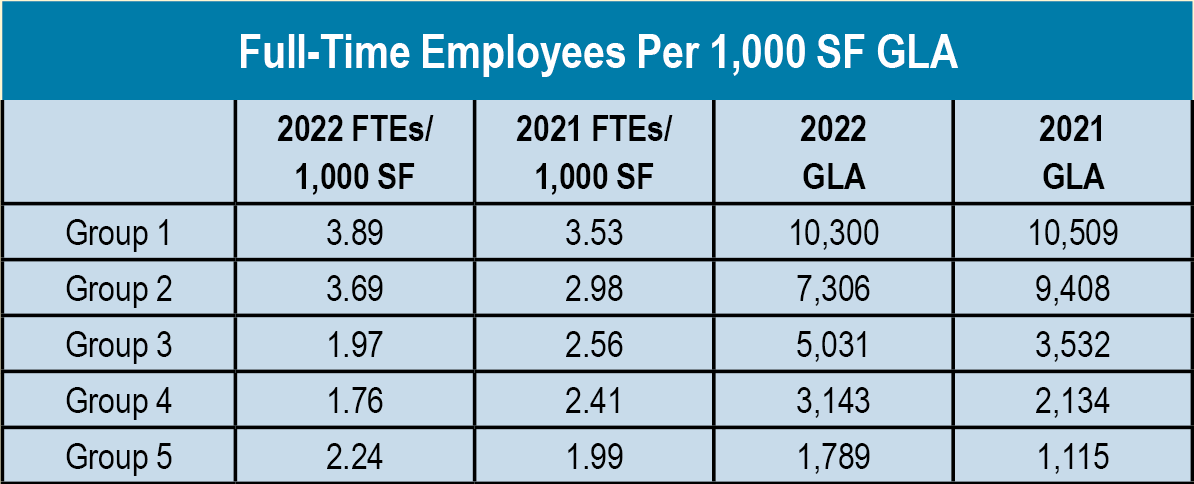
We also looked at the full-time equivalent (FTE) employees per 1,000 SF GLA. For perishables-heavy stores in Groups 1 and 2, it took about four FTEs per 1,000 SF to operate their stores. For Groups 3, 4 and 5, it took about two FTEs.
Outreach
Here, too, we see apathy is out. Last year, 7% of respondents reported using no supplemental materials. This year, all respondents are investing in some form of outreach. In addition to methods below, 7% of retailers are getting creative with other avenues, including publicly supporting local non-profits and creating in-store monthly sales flyers. Good old word-of-mouth got a mention, and for a fresh take, one retailer is using text message marketing/SMS marketing with SlickText.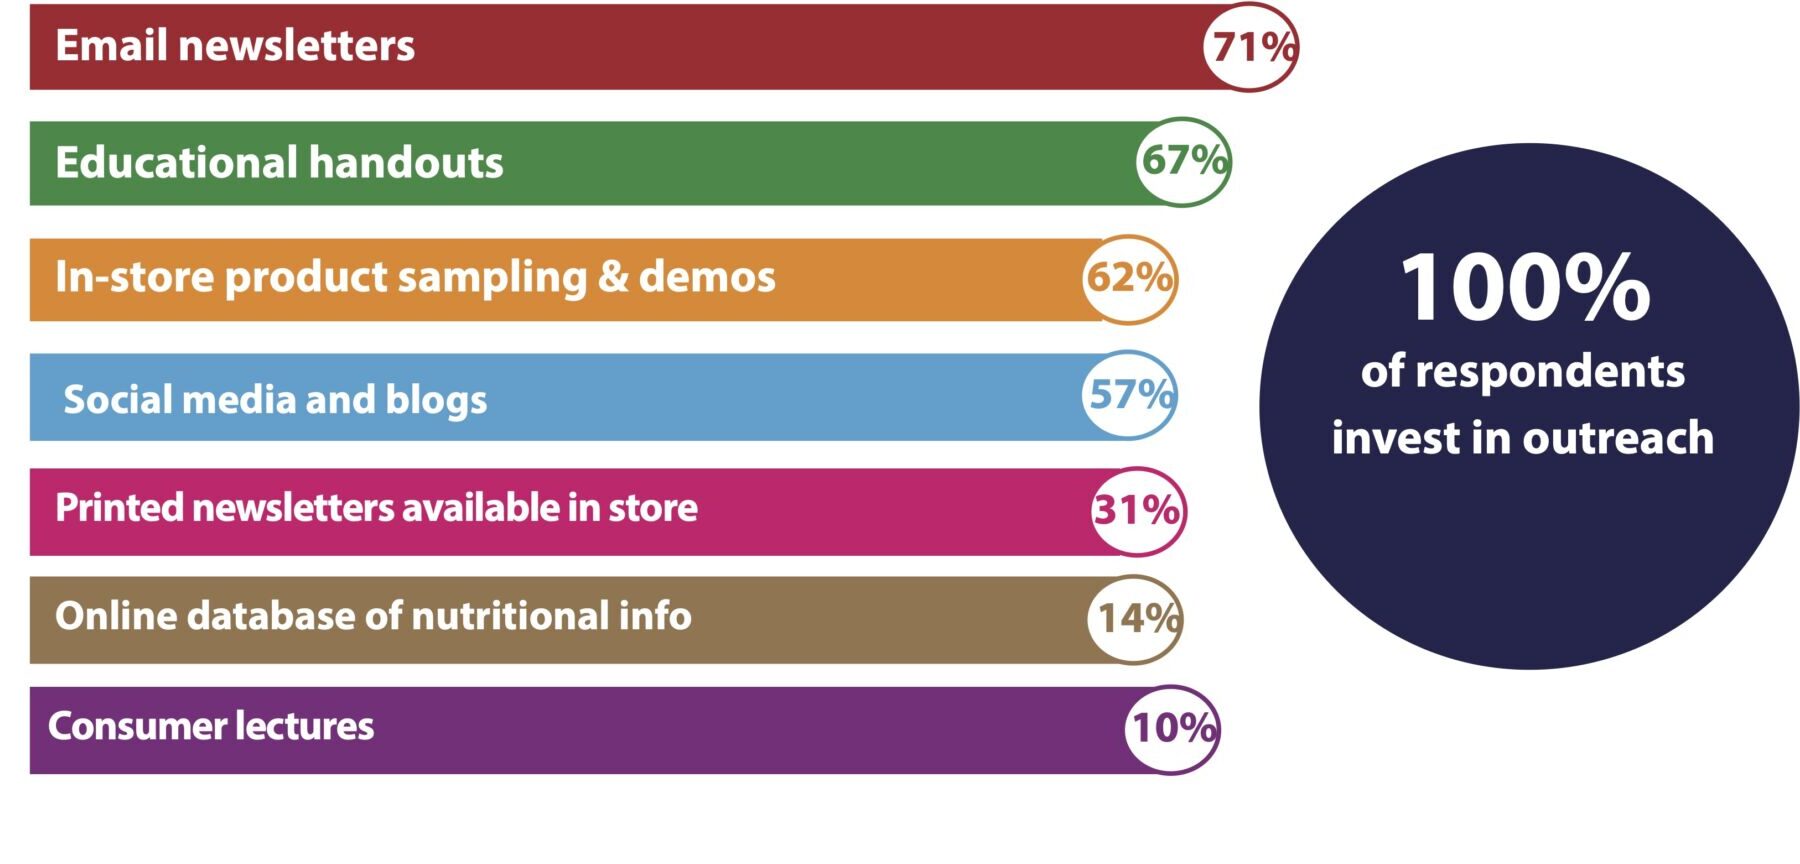
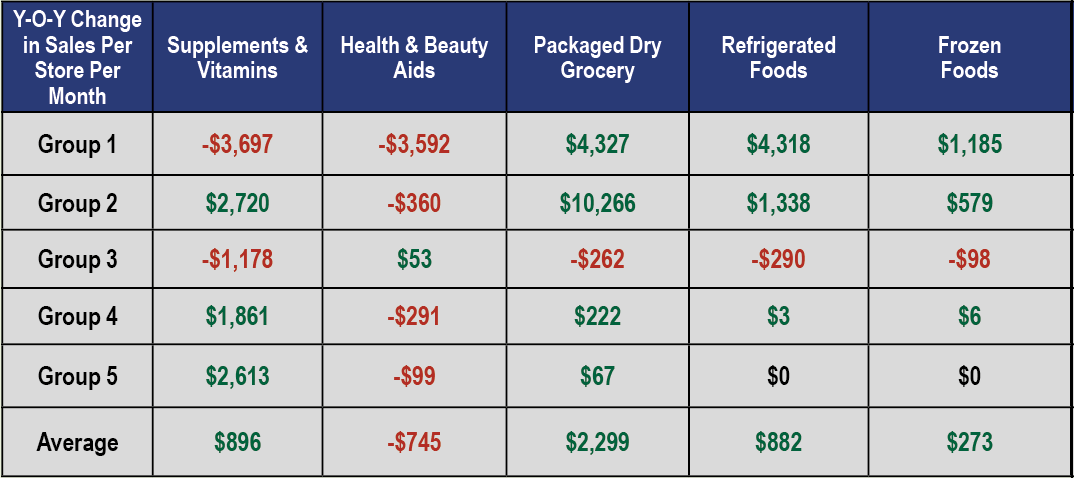
Same-Store Sales: Year-Over-Year $ and % Change, By Department and Store Group
As we said earlier, the annual survey is like sampling a vintage cabernet sauvignon. Each year we taste from a different vineyard (the different group of respondents that participates each year). But we also ask each year’s group to tell us about their own prior year’s results—like sampling two vintages from the same vineyard—which yields our same-store results.Y-o-Y Dollar Change in Sales Per Store, Per Month.
Key Findings: Group 1: These high-perishables stores lost vitamin, supplement, and personal care (HABA) sales while gaining in all other departments, especially dry and refrigerated grocery.Group 2: Also high perishables (average 45% of sales), these stores had major gains in dry grocery but drifted lower in fresh produce and prepared foods sales, and lost momentum in bulk. This is not surprising given the pandemic-driven limitations to self-serve in these departments.
Group 3: This group suffered losses in sales in every department save non-food and household. These 5,000-square-foot stores (with an average 21% of sales from perishables) perhaps were not large enough, nor did they carry enough fresh foods to attract daily shopping.
Group 4: These stores (average 6% sales in perishables) gained significantly in vitamin and supplement sales, in keeping with their focus on the supplements department. Group 4 also did very well in non-food and household, perhaps because this department contains sanitization and cleaning products.
Group 5: Our smallest and most-focused supplements stores also gained significantly in supplement sales while drifting lower in most other departments.
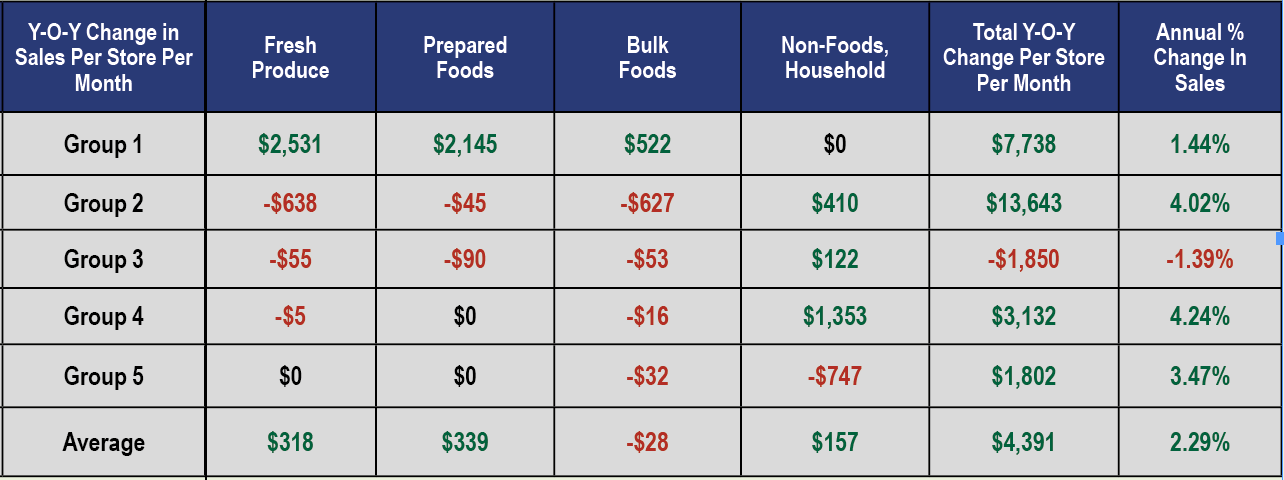
Y-o-Y Annual Percentage Change in Sales.
Key Findings: Overall, respondents to this year’s survey grew by 2.29% vs. their same-store-sales in the prior year. This is remarkable, considering our survey sales period of the first half of 2021 includes comparisons with the first half of 2020, when pandemic hoarding was at its peak. Vitamin and supplement-focused stores fared best overall, growing 3.47% and 4.24% year-over-year in Groups 5 and 4, respectively. Sales at the top, in Group 1, increased 1.44% year-over-year, boosted by dry grocery as well as refrigerated foods. Group 2 stores benefited from robust dry grocery sales to turn in total year-over-year growth of 4.02%. Group 3, our 5,000-square-foot stores with just 21% of sales from perishables, were the only ones to suffer losses year-over-year, shedding (-1.39%) in sales.Takeaway: This year’s survey continues to reveal evidence that focusing more either on fresh perishables foods, or on the vitamins and supplements department, is the key to sustainable growth, even in the face of pandemic. We believe this is why independent natural organic retailers are either reducing their fresh foods, or going bigger into the fresh departments. The middle ground—between 2% and 29% of sales from fresh perishables foods—is a dangerous place to be, and our survey shows retailers are beginning to recognize this fact.
Investing in Growth
Last year, 14% of respondents remodeled or expanded. Those who made the investment remodeled both small and large amounts of space, ranging from 100 square feet to 6,000 square feet. Retailers spent between $10 to $50 per square foot on their remodels, updating an average of 600 square feet. The average cost per remodel was $9,000, or about $15 per square foot.Taking a closer look at where that money went, four departments—vitamins and supplements; personal care; refrigeration including grab & go; and services/ practitioner areas—made up 73% of all remodels. Three departments—frozen; non-food; and household and pet products—made up the remaining 27% of remodels. No respondents bothered to remodel the juice bar, café, or deli, likely since these departments were already scaled back in early 2020 as the pandemic flared. Retailers also left the dry grocery and bulk departments alone last year.
Plans for future expansions & remodels: 12% of respondents plan to remodel or expand their stores this year, modifying an average of 700 square feet and spending $10,000.
The non-foods departments will get the most attention, making up 20% of all planned remodels or expansions. Retailers also will continue to focus on the vitamins and supplements department, with 15% planning to remodel or expand. Juice bar, café and deli do figure in this year’s plans, making up 10% of all remodels.
Four more departments—frozen, refrigerated, personal care, and household and pet—will make up 40% of all remodels. And fresh produce, dry grocery, and services/practitioner areas will account for 15% of remodel activity.
Not getting the dollars: For the second year, retailers appear content to leave their bulk foods departments alone.
Expansions: Most (93%) of respondents stood pat on the number of stores they operated last year; 7% added one store. Looking to the future, most (89%) of storekeepers plan to operate the same number of stores this year as they did last year, though 7% plan to open one additional store this year, 2% plan to open two new stores and another 2% have plans for three new stores this year.
Sales Overview
Survey respondents told us their results for the 12-month period ending June 30, 2021. Just over half (55%) reported that sales increased or stayed the same.31% of stores increased total sales 24% of stores stayed about the same 45% of sales registered store declines
Forecasting Future Sales
Optimism reigns, as 93% of respondents expect sales to increase or remain the same this year, leaving just 7% with a negative outlook. One of those with concerns told us: “With out of stocks, online competition, and lack of desire to enter stores, the next year will not be good.”30% of stores believe sales will increase 63% believe sales will hold steady 7% believe sales will decrease
The Bottom Line: Net Profits
Getting down to the key numbers, here’s how stores fared during the survey period.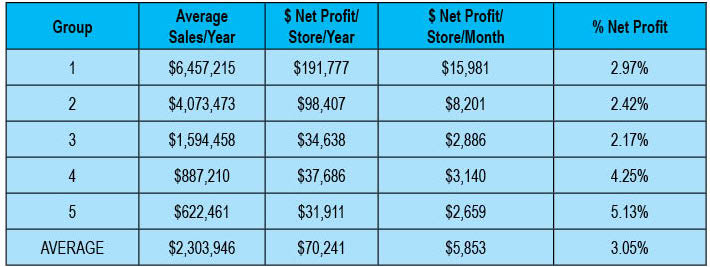
Retail Space vs. Back-Room Support Areas
The more perishables a store sells, the more back room non-retail support area it needs for walk-in coolers and freezers, produce preparation areas, receiving and storage.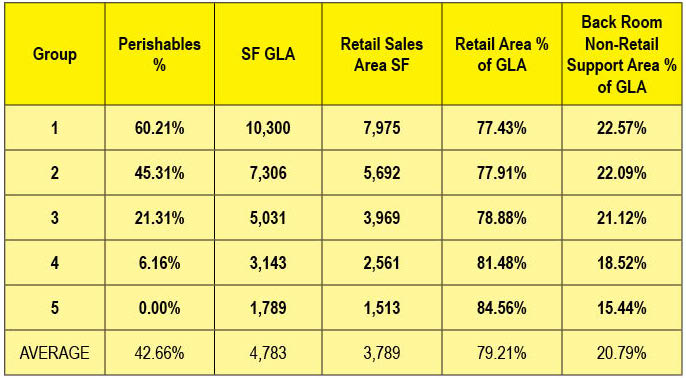
Taking Stock of Private Label
In this year’s survey, fewer than 50% of respondents said they carry private label. The breakdown: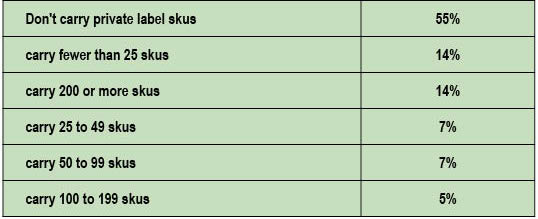
Marketing and Promotions
How are retailers advertising and promoting the business? Participation and promotion on social media once again took the number one slot among advertising and promotion techniques, with 79% of respondents participating, while 67% have a website. In-store materials such as lectures, handouts, product sampling, and store newsletters are still popular, with 62% of respondents focusing their efforts here.Interesting to note this year: 31% of stores are opting to pay for online advertising, which seems like a lot since it can be expensive to acquire customers online (see the January Merchandising Insights column)—though perhaps it’s not so surprising given the significant percentage of respondents that do e-commerce.
Less popular promotional methods among our respondents: Radio (19%), direct mail (14%), TV (10%), and the yellow pages (4%).
Respondents are also trying out new strategies, or turning back to older ones. Text message marketing got a few mentions, and the reward system TapMango got a nod. Going the traditional route, billboards, five-and-dime magazines, and local newspapers are still delivering for some retailers.
A positive note: Unlike last year, perhaps embarrassed by being perceived as apathetic or, waking up to the necessity of marketing, no respondent claimed to be doing nothing to market their stores.
How much is being invested? Take a look:
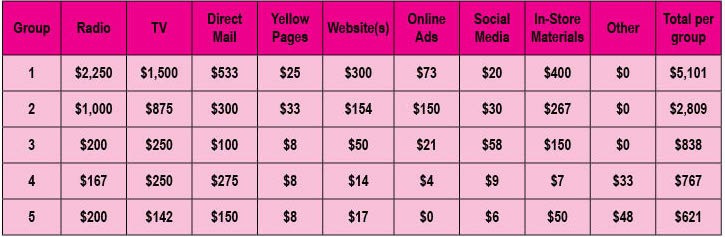
This year's survey was sponsored by Nutrasource.