 That’s according to the 2021 Organic Produce Performance Report, released by Organic Produce Network and Category Partners. The report notes that the consistent year-over-year growth is in spite of the return of foodservice in 2021.
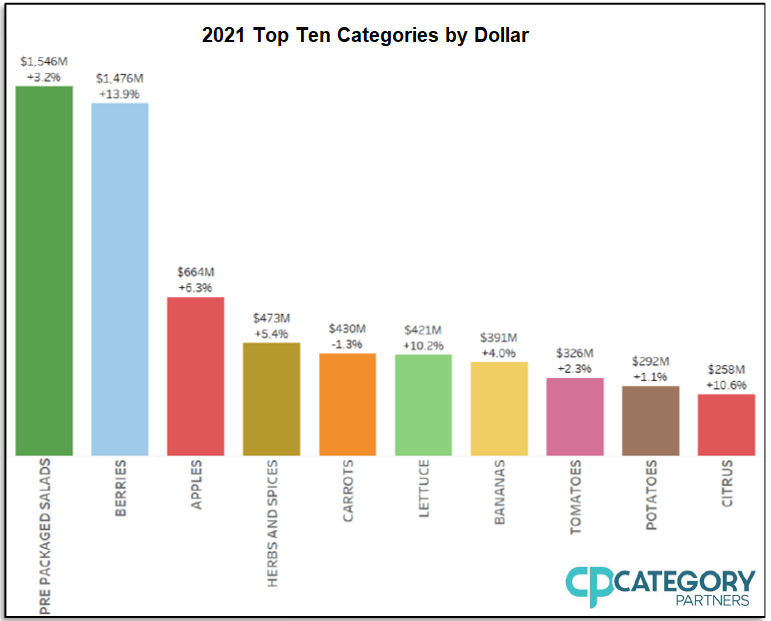
The organic fresh berry category was a top performer, with a 10% rise in volume and a 14% gain in sales—but packaged salads beat it out for the top category by sales, hitting $1.5 billion, in spite of having one of the highest organic price premiums, with a price point $3.11/pound over conventional. Berries, apples, and packaged salads accounted for two-thirds of all organic fresh dollar growth.
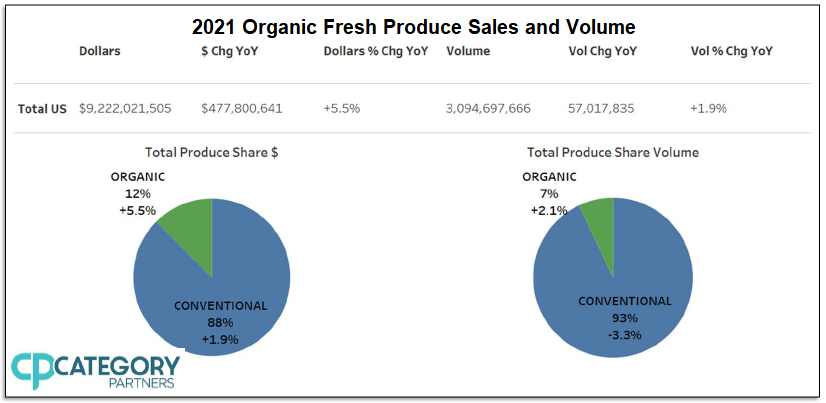
 “While a gap remains in the average retail price per pound between organic and conventional, the price increases in both categories last year were remarkably similar,” said Steve Lutz, SVP of Insights and Innovation at Category Partners. “The average retail for conventional increased by $0.08/lb. to $1.57/lb., while organic increased from $0.094/lb. to $2.97/lb. Granted the percentage increase in organic [was] smaller, but the aggregate change was very close.”
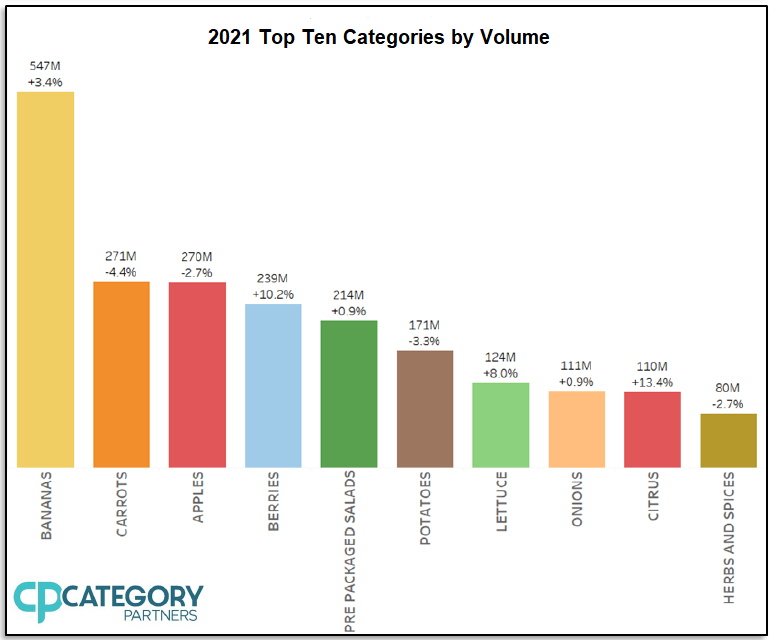
In 2021, overall organic produce volume increased by 2% y-o-y, compared to the -3.3% volume loss observed in conventional produce. Organic bananas reigned, with 547 million pounds sold in 2021, showing a 3.4% increase from the previous year. However, berries, watermelons, and citrus drove total volume increases, while packaged salads, potatoes, and carrots actually saw a decline.
 “Sales of organic produce in 2021, while up a bit less than expected, remain on par with the historical long-term growth trends we have come to expect for organic produce,” said Lutz. “As the foodservice sector reopened, consumers began to shift some meals back to foodservice channels. The net result in 2021 is many produce categories—especially vegetables—had weaker growth when matched against 2020.”
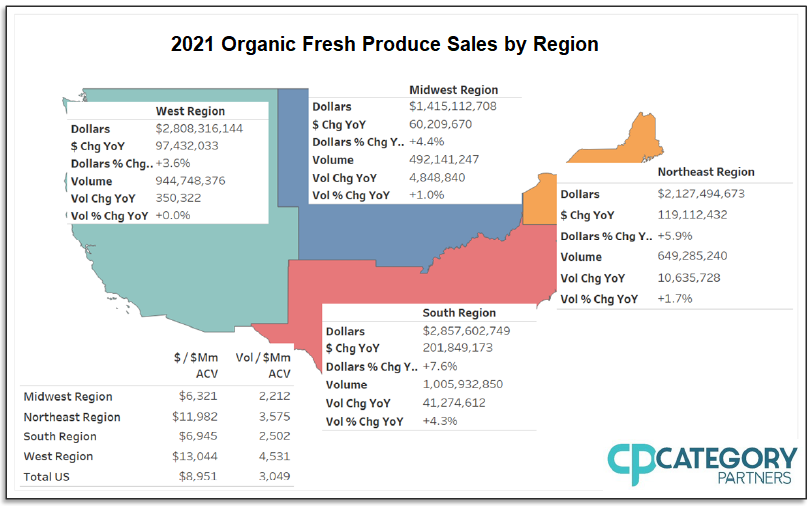
All four geographic regions of the country experienced modest single-digit dollar growth in 2021, with the strongest gains made in the South, which saw organic dollars jump 7.6%, while volume increased 4.3%. The West experienced year-over-year sales growth of 3.6%, while volume was flat.
 The fourth quarter of 2021 was the eighth consecutive quarter of organic sales growth, with a 4.9% increase from the same period last year.
“It is very apparent that consumer supermarket food purchases the past year reflected more traditional buying trends as compared to the COVID-inspired purchasing changes we saw in 2020,” said Matt Seeley, CEO of Organic Produce Network. “At the same time, we saw many organic fresh produce categories continue to show solid growth as part of the longer-term trend of consumers moving to organic produce and, in turn, growing organic’s share of market.”
The 2021 Organic Produce Performance Report used Nielsen retail scan data covering total food sales and outlets in the U.S. from January through December 2021. A complete version of the report will be made available atwww.organicproducenetwork.comin mid-February.