In the second quarter of last year, the COVID pandemic shut down most foodservice, and supermarket sales jumped as people began making more food at home. As the pandemic slows and foodservice is reopening, conventionally grown fresh produce supermarket sales are showing a corresponding decline—dollar sales are down 3.3%, and volume is down by 8.6%, compared to Q2 2020. Organic fresh produce, on the other hand, is up 4.1% in sales and .2% in volume, compared to Q2 2020.
![Chart titled "Q2 2021 Organic Fresh Produce Sales and Volume." Chart has a line describing total US numbers. Dollar sales: $2,296,180,001. Dollar change year-over-year: $89,864,221. Dollar percent change year-over-year: +4.1%. Volume: 762,512,004 [unit isn't mentioned]. Volume change year-over-year: 1,898,893. Volume percent change year-over-year: +0.2%. The image also contains two pie charts. One is labeled Total Produce Share Dollars, and shows that Organic makes up 12.2% of the pie chart, with conventional taking the rest of the 87.8%; Organic, however, is noted to have 4.1% growth, while Conventional has a 3.3% decline. The second pie chart is labeled Total Produce Share Volume. Organic has 6.7% of the pie chart, while Conventional has 93.3%; however, Organic shows 0.2% growth, while conventional shows 8.6% decline. The image has the Category Partners logo in the bottom left corner.](https://wholefoodsmagazine.com/wp-content/uploads/2021/07/Q2-2021-Organic-Fresh-Produce-Sales-and-Volume.png) "It’s apparent that consumer supermarket food purchases now increasingly reflect the more traditional buying trends versus COVID-inspired purchasing changes,” said Steve Lutz, SVP of Insights and Innovation at Category Partners. “It is also encouraging that even though consumer purchases of conventional produce were lower than Q2 2020, organic produce continued to generate growth.”
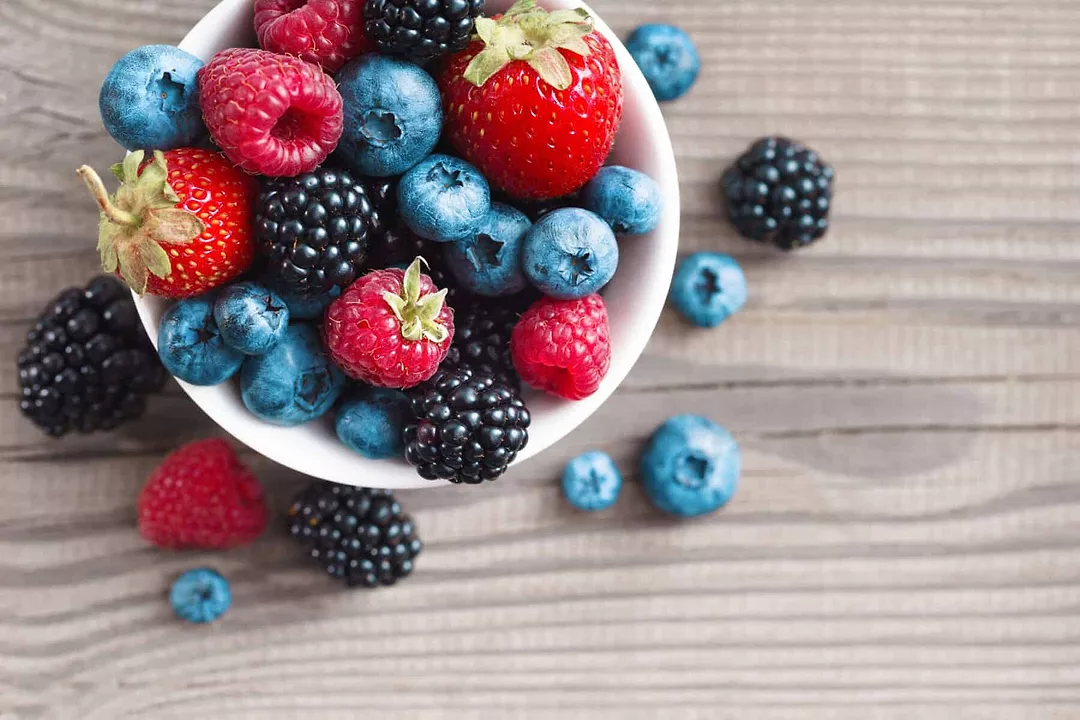
"It’s apparent that consumer supermarket food purchases now increasingly reflect the more traditional buying trends versus COVID-inspired purchasing changes,” said Steve Lutz, SVP of Insights and Innovation at Category Partners. “It is also encouraging that even though consumer purchases of conventional produce were lower than Q2 2020, organic produce continued to generate growth.”Other notable changes: The berry category has, for the first time, displaced packaged salads as the number one organic category in dollar sales, having increased 19% y-o-y, with volume up 16% in the same time frame. Organic berry sales topped $435m for the quarter.
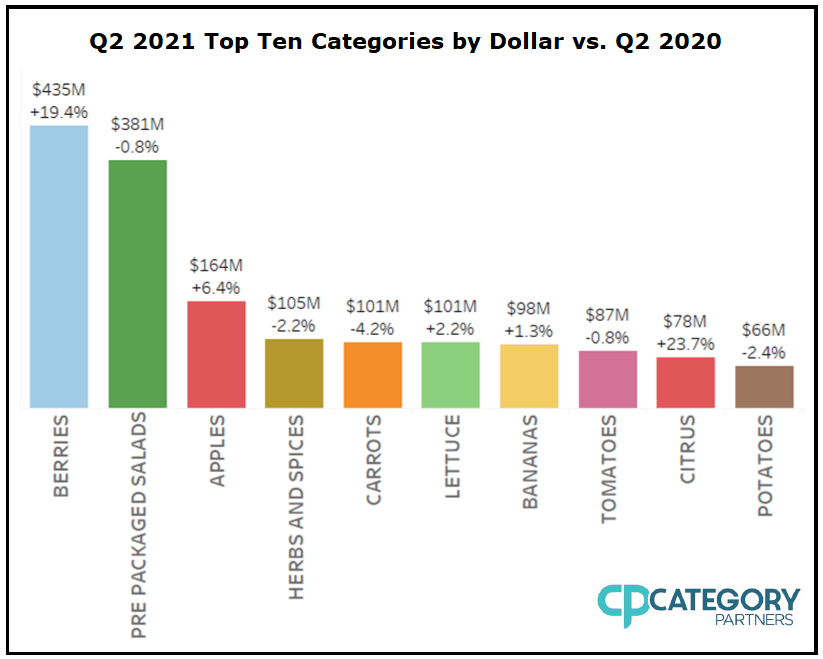 The top 10 organic categories were a mixed bag: berries, apples, lettuce, bananas, and citrus showed sales gains, while packaged salads, herbs, carrots, tomatoes, and potatoes showed modest declines.
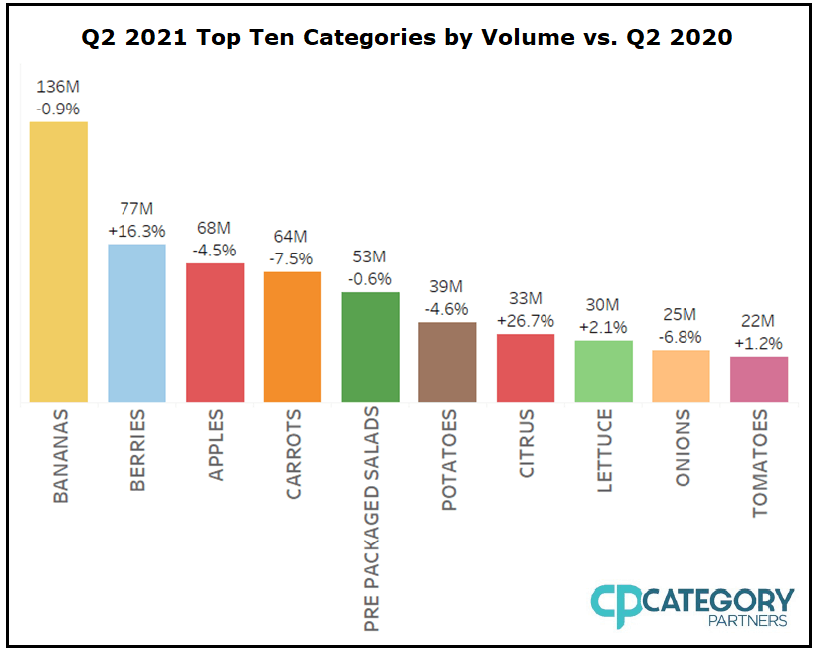 “As we come out of the pandemic, and foodservice channels have reopened, the widespread pantry loading that occurred during the second quarter of last year has subsided,” said Matt Seeley, CEO of Organic Produce Network. “The result is that many produce categories showed little, if any, growth in Q2 2021 when compared to last year. The fact remains organic fresh produce continued to generate year-over-year growth in sales and volume, while conventional produce declined against the same period last year.”
Related: Confessions of a Middle Age “Glyphoholic” Rodale Institute Receives $1.2 Million Donation OTA Asks Court to Reinstate Animal Welfare Standards
Organic sales and volume declined in the Western part of the United States, although it still lead the country in total sales and volume. The Northeast region, on the other hand, saw a y-o-y jump in dollar sales by 7.7% and a 3.6% volume increase.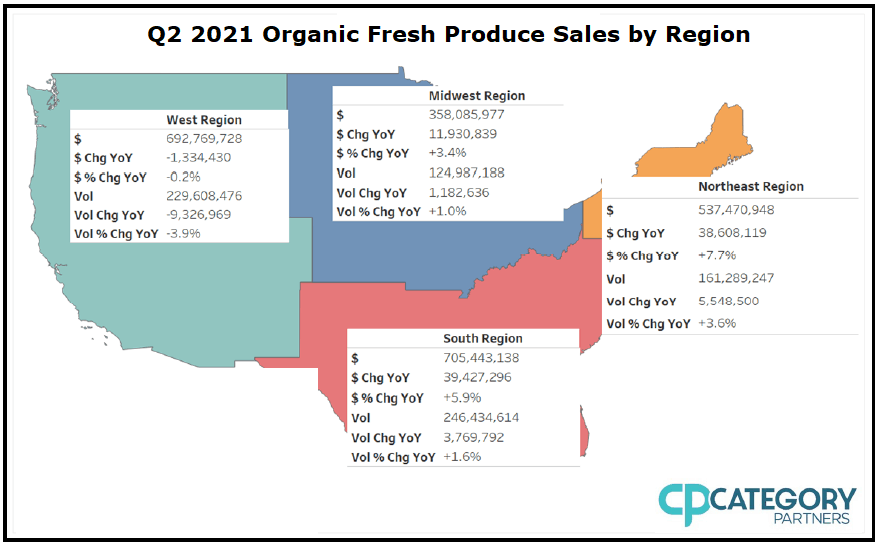 The report is available atOPN’s website, here.