
So, how did all these issues affect independent natural products retailers? According to data we collected for the 2017 WholeFoods Magazine Annual Retailer Survey, independents saw an increase in sales and profits. Natural products appear to be expanding their appeal beyond the core Baby Boomers to Millennials; the 77-million-strong generation now reaching 30-something years old.
This overview reveals some of the most important findings from the survey, which asked retailers about their results for the 12 months ended June 30, 2016. You’ll be able to access more coverage of survey findings at WholeFoodsMagazine.com. And stay tuned for our live webinar on Wednesday, February 22, 2017, where we will focus on key findings that will help inform your strategic business decisions. You’ll also be able to see the webinar on demand in our Retail Content Library at WholeFoodsMagazine.com/Retail-Content-Library in late February.
Survey MethodologyFor 39 years, WholeFoods Magazine has surveyed independent natural products retailers about their sales, profits and expenditures. The data collected by WholeFoods is truly one of a kind. No one else zeroes in on this information from strictly the perspective of independent natural products retailers.
While the survey has always been a standout—used annually by businesses large and small to
 consider expansion, justify a loan or to better one’s practices—the editorial team felt it could make a great survey even greater.
For the first time, WholeFoods partnered with Readex Research to give readers an easy way to participate in our survey through digital platforms. Readex reached out to a portion of WholeFoods readers by email in July and August 2016, resulting in an overwhelming response. The 2016 dataset is by far the biggest and best WholeFoods survey to date, and the publication is planning to build on the success of this year’s survey in future years.
In exchange for participating, survey takers will receive exclusive deep-dive insight into 2016 data. In addition, one participant was selected at random to receive a $250 American Express gift card. Congratulations to Farmer’s Natural Foods, Hinesville, GA, and a huge “Thank You!” to all of this year’s survey participants.
About the ParticipantsSurvey participants represented a diverse mix of stores, from small, supplement-oriented retailers, to large fresh-foods-focused grocery stores. Fully 85% of participants had multiple physical locations, ranging from two to more than a dozen stores.
Because of this broad diversity in types of store, WholeFoods analyzes the data through the lens of perishable foods; anything requiring refrigeration, from fresh produce, dairy, meat and seafood, to frozen items, and fresh foods prepared for immediate consumption in the deli or grab-and-go case. More than any other variable, perishables determine a store’s size, which customers it will attract, and how often they shop.
This year, we were able to divide the large pool of respondents into five roughly equal groups (quintiles, or “Q”) each representing approximately 20% of participants, based on the percentage of perishables the stores sold, as follows: Quintile 5: ≥ 46% perishables Quintile 4: 34 – 45% perishables Quintile 3: 10 – 33% perishables Quintile 2: 1 – 9% perishables Quintile 1: 0% perishables
Survey respondents represented businesses from coast to coast, with the most responses from the South (32%), East (28%) and West (21%), followed by the Midwest and Rocky Mountain regions which made up 11% and 7% of respondents, respectively. Stores were located in all trade area types, from small rural towns to major metropolitan centers.
Store owners, CEOs or presidents made up 46% of respondents, with general managers, stores managers, and department heads making up the rest. As with earlier surveys, respondents were veterans, with stores under present ownership an average of 20.7 years, and in existence for 27.3 years.
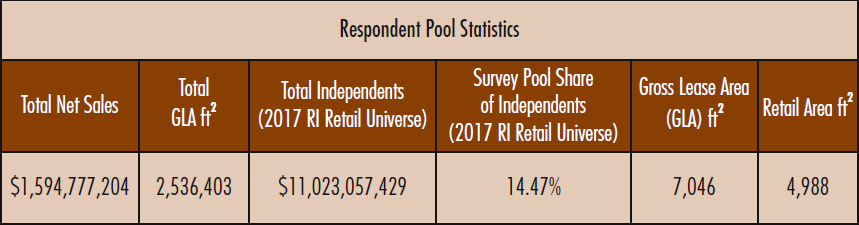
The survey represents stores as small as 800 ft2, and includes retailers as large as 40,000 ft2. With the larger number of survey participants this year, average store size has jumped significantly, to 7,046 ft2 gross lease area (GLA) from 4,432 ft2 in last year’s survey.
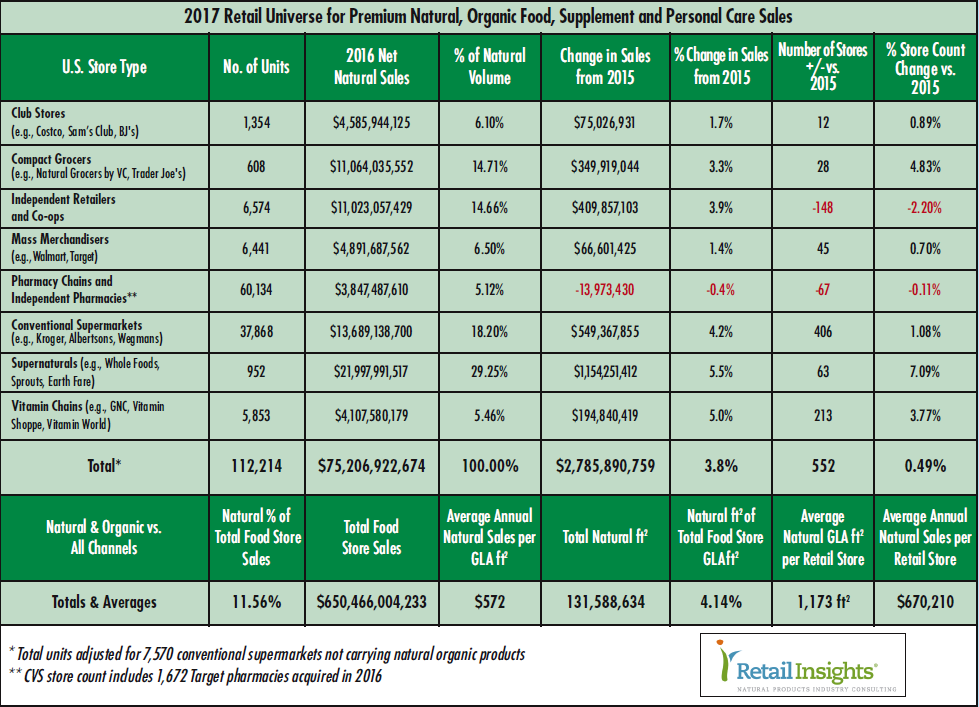
Sales Results and PredictionsWe are proud to report that the independent retailers in this year’s survey generated a total of $1.59 billion in sales, up from last year’s $1.06 billion. This represents 14.5% of the total $11.0 billion independents sold in 2016, according to the just-released 2017 Retail Universe for Premium Natural, Organic Food, Supplement and Personal Care Sales, which covers the entire U.S. natural organic food-store universe and which you can find on Page 26 at the end of the Overview.
This years’ respondents to WholeFoods’ survey also represent 2.5 million ft2 GLA, rising from 1.7 million ft2 in last year’s survey, with average sales per store climbing to $4,429,937, a 62% increase over the $2,729,200 respondents reported last year.
Survey participants overall reflected a bright sales picture, with 70% of respondents saying their sales increased over the past 12 months by a median 11% (Half of the responses were higher, half lower). Nearly 31% expect to maintain their annual sales rate through next year, with another 66% predicting an increase of up to 13% in 2017.
What’s their secret? Turns out, it’s no secret at all. Retailers who did well in 2016 were willing to update their businesses. A whopping 78% say they did some remodeling over the past 12 months, spending on average $45,583 to renovate roughly 2,231 ft2. And, behind the bullishness for 2017, 86% of respondents plan to expand their stores next year by an average of 1,120 ft2. Others would expand if they could, but the leasable area of their building doesn’t permit.
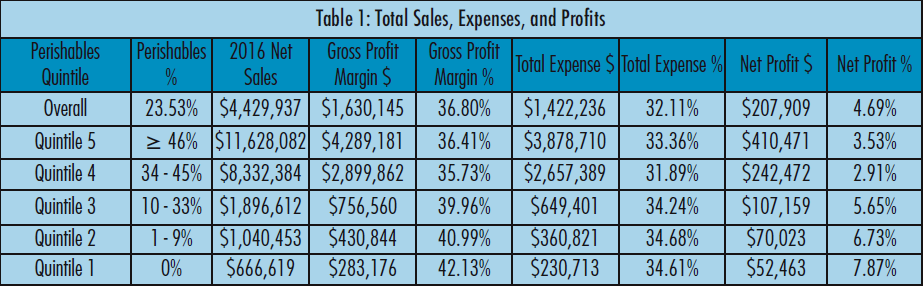
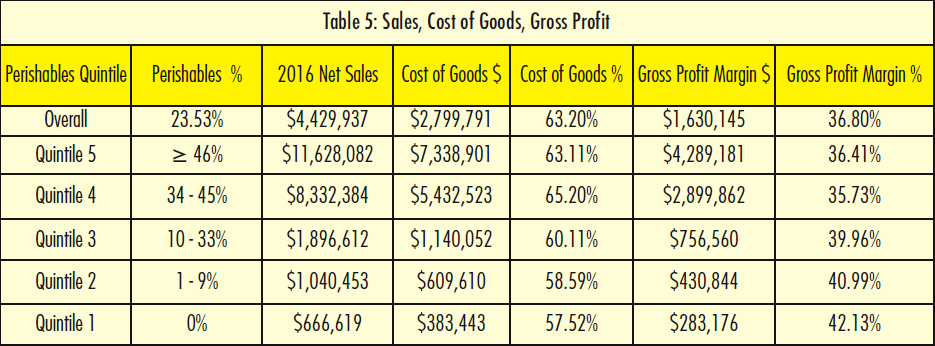
Digging Down to DetailsWhile the average sales per store for all survey participants were $4.4 million, the detail tells a more nuanced story (see Figure 1). Stores with 0% to 33% (Qs 1, 2, and 3) of total volume from perishable foods averaged sales ranging from $666,619 to $1,896,612. But stores with perishables sales from 34% to 46% or more (Qs 4 and 5) saw average sales of $8,332,384 to $11,628,082 (Table 1).
 These food-oriented stores reported gross profit margins from 35.73% to 36.41%. Supplement-oriented stores saw fatter gross profit margins, from 39.96% to 42.13% (Table 1).
Food-heavy retailers spent more on direct store labor as a percentage of sales—as you’d imagine with chefs, butchers, and so forth—with total compensation, including wages and benefits, running 19.14% of sales to 21.89% of sales. Supplement-focused stores, which are simpler to operate without fresh-foods departments, spent from 13.82% of sales to 15.95% of sales. We believe some of the lower-volume stores in Qs 1, 2 and 3 have additional unpaid labor hours supplied by owners that are not counted in labor costs (Table 2).
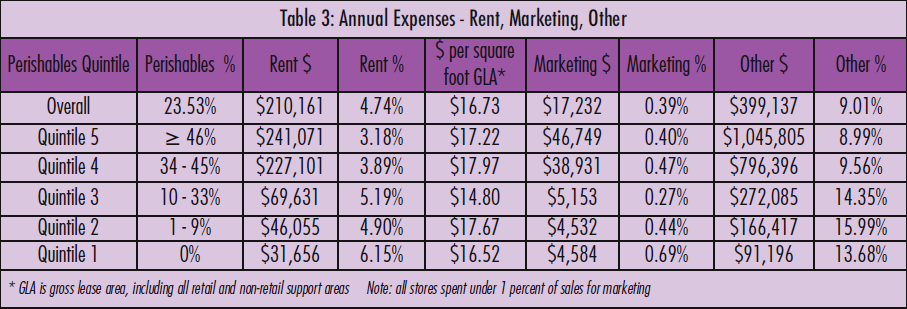
Rent as a percentage of sales ran 3.18% to 3.89% for food-heavy stores, and 4.9% to 6.15% for supplement-focused stores. Keep in mind, these stores have an average age in the marketplace of 27 years, allowing them ample time to build significant sales volume, which helps keep rent as a percentage of sales relatively low (Table 3).
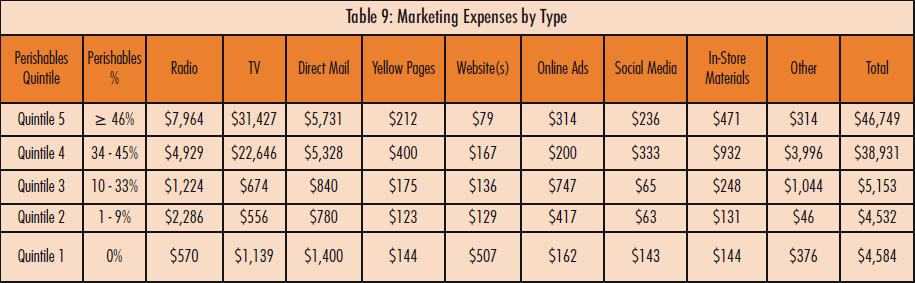
The vast majority (97%) of WholeFoods survey participants felt it a priority to promote their business through marketing in 2016. Even the smallest stores spent an average of about $400 per month on one form of marketing or another, with the larger stores spending $3,000 to $4,000 per month. Because the responding stores are a mature age, marketing expenses as a percentage of sales stayed under 1% for all store types.
Net profits, after all direct store expenses, ranged between 2.91% and 3.53% for food-focused stores, and from 5.65% to 7.87% for stores emphasizing nutritional supplements. Of course, it is worth noting that in absolute dollars, supplement-based stores generated between $52,463 and $107,159 in net profits, compared to $242,472 and $410,471 for food-focused stores. Even though food-based stores work on smaller percentage gross and net profit margins than supplement-based stores, they generate more absolute dollars in profit due to their orders-of-magnitude larger average sales, roughly $10 million for stores with 34% or more sales from fresh foods compared to $1 million for supplements-focused
 stores (Table 1).
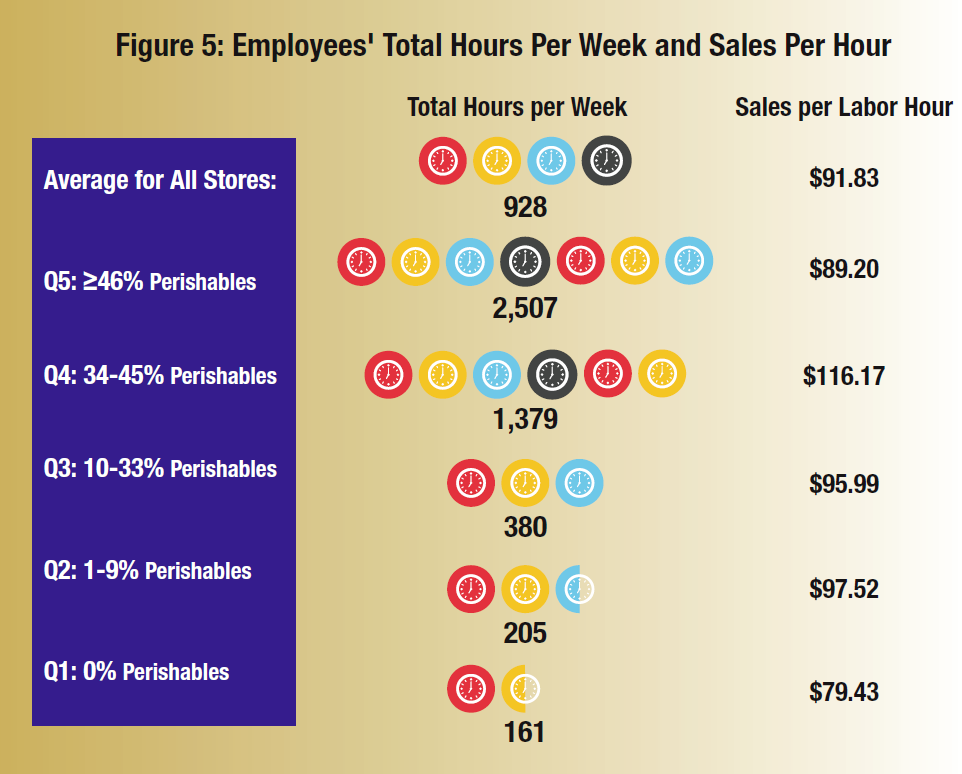
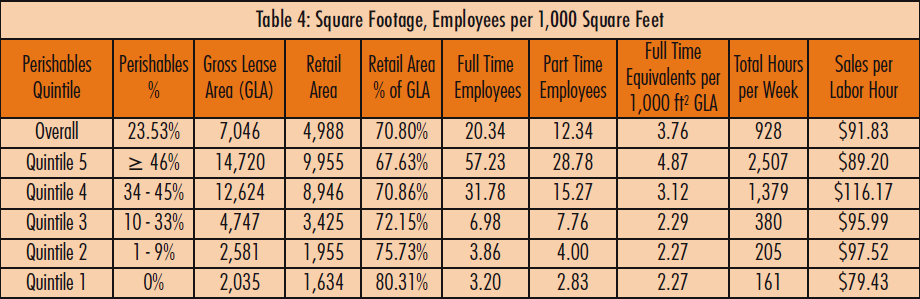
In one of the unique features of the WholeFoods survey, retailers reveal how many employees it takes to run a food store compared to running a supplement store. As you would imagine, it takes more employees per 1,000 ft2 to run an intense foodservice operation than it does a store that just sells bottles of vitamins. And we see this in the data. Supplement focused stores require just over two (2.27 to 2.29) employees per 1,000 ft2 to operate efficiently while food-oriented grocers needed from 3.12 to 4.87 employees per 1,000 ft2, or roughly 50% to 100% more employees per square area (Table 4).
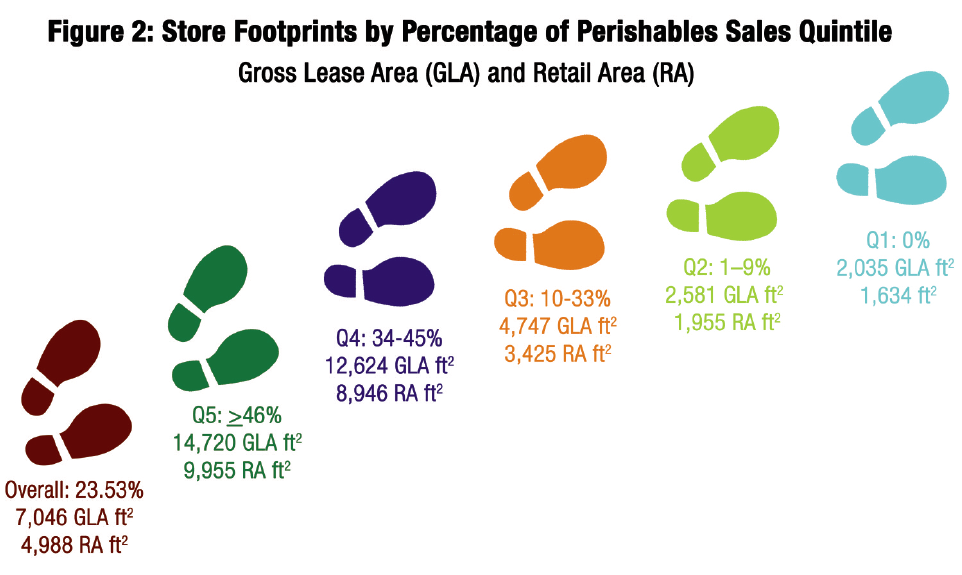
And food-focused stores in the survey were naturally larger than stores selling mostly supplements. Survey food-store size ranged from 12,624 ft2 to 14,720 ft2 GLA, compared to 2,035 ft2 to 4,747 ft2 for supplement-focused stores (Table 4).
When you build a kitchen, with ovens and a hood vent, prep tables for the chef’s case and grab-and-go refrigerator, wash-sinks for produce prep, and refrigerated walk-ins to store all of these perishables, your back room naturally takes up a larger portion of your store than if you are just storing boxes of cereal and cases of supplements. Non-retail support areas for food-oriented stores in the survey ran from 29.14% to 32.37% of GLA compared to 19.69% to 27.85% for supplement-focused stores. Here, we report the flip side of support area, the average retail area of the store (Table 4).
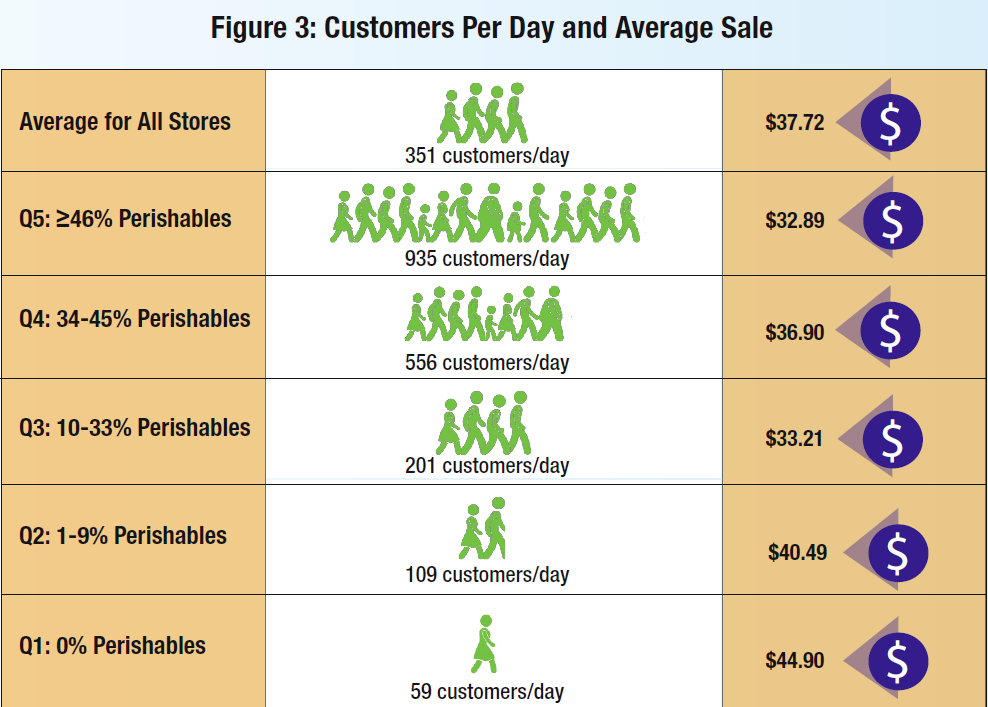
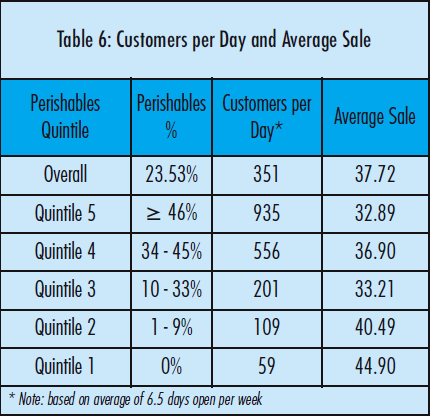
One of the starkest contrasts between food-oriented stores and supplements-focused stores is the average customers per day (see Figure 3). The typical vitamin-oriented store in the survey reported seeing between 59 and 201 customers per day, while fresh-food stores enjoyed between 556 and 935 customers per day. With the higher traffic, the average basket size in food stores was a bit smaller, at $32.89 to $36.90, compared to supplement stores, which ranged from $33.21 to $44.90 per transaction. Please note that some stores in the survey were open for business seven days per week, while others were open six days. Overall, the average days open in the survey was 6.5 days.
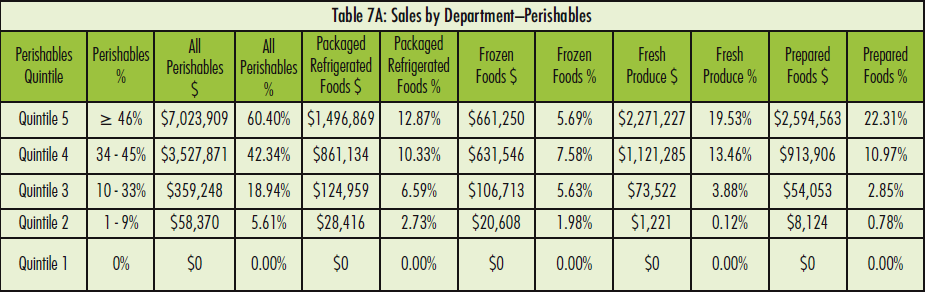
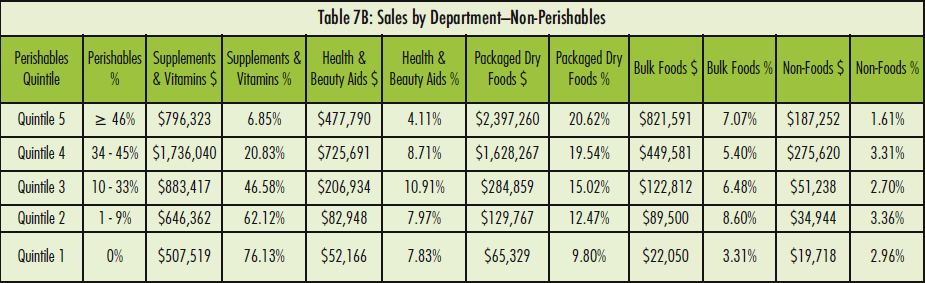
Taking a closer look at sales by department, the contrast between food-oriented stores and supplement-oriented stores comes more clearly into focus. Stores that emphasize vitamin sales generate 46.58% to 76.13% of sales from the nutritional supplement category, compared to 6.85% to 20.83% for the larger and largest food-oriented stores (see Chart B). Keep in mind, however, that because of the roughly 10-times greater sales in the food-oriented stores in the survey, absolute dollar sales of supplements ran between $796,323 and $1,736,040, compared to $507,519 to $883,417 in supplement-oriented stores (Table 7A and 7B).
 One of the key differences between food-oriented stores and supplement-based stores is the importance of the prepared foods department. In food-based stores, the deli or kitchen provided 10.97% to 22.31% of sales, or $913,906 to $2,594,563. Supplement-oriented stores in the survey averaged no more than $54,053 in prepared foods sales.
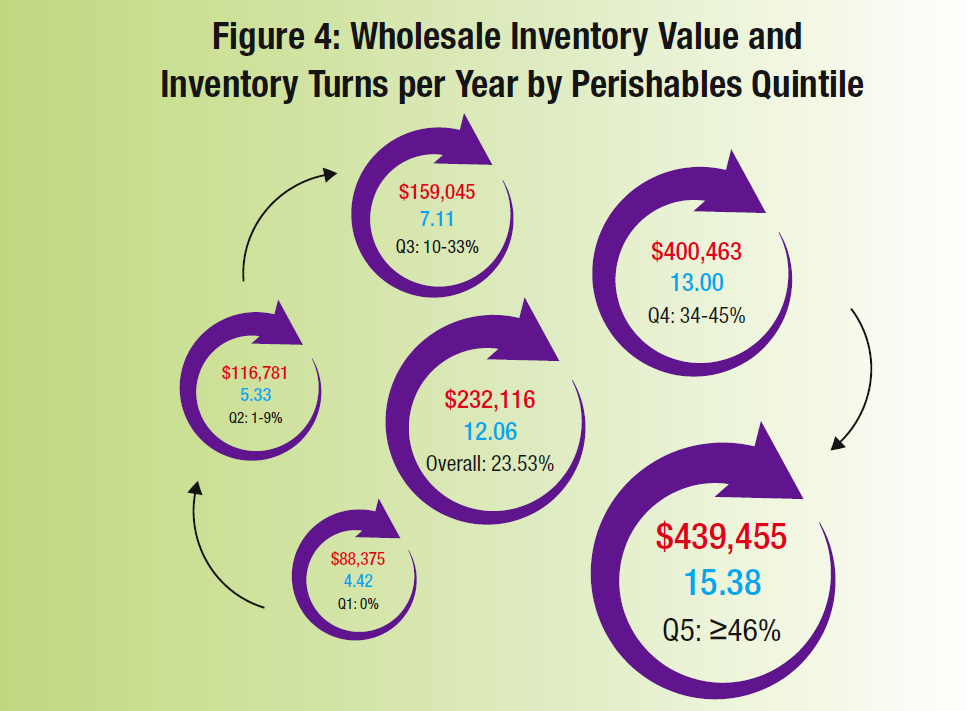
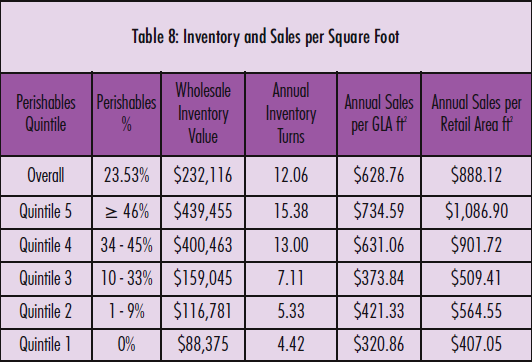
Store efficiency—how quickly or slowly retailers turn over their entire inventory per year—varies dramatically between store types. Supplement-focused stores that stock products with a repeat purchase cycle of 30 to 60 or even 90 days, turn their inventories much more slowly than fresh-food oriented stores. Stores that serve fresh food and sell lots of fresh produce have just a few days before product starts to go bad. The numbers tell the story. Supplements-based stores in the survey turned over their inventories 4.42 times per year to 7.11 times per year—about once every two to three months—while fresh-food oriented stores turned over their inventories from 13 to 15.38 times per year, or more often than once per month (see Figure 4).
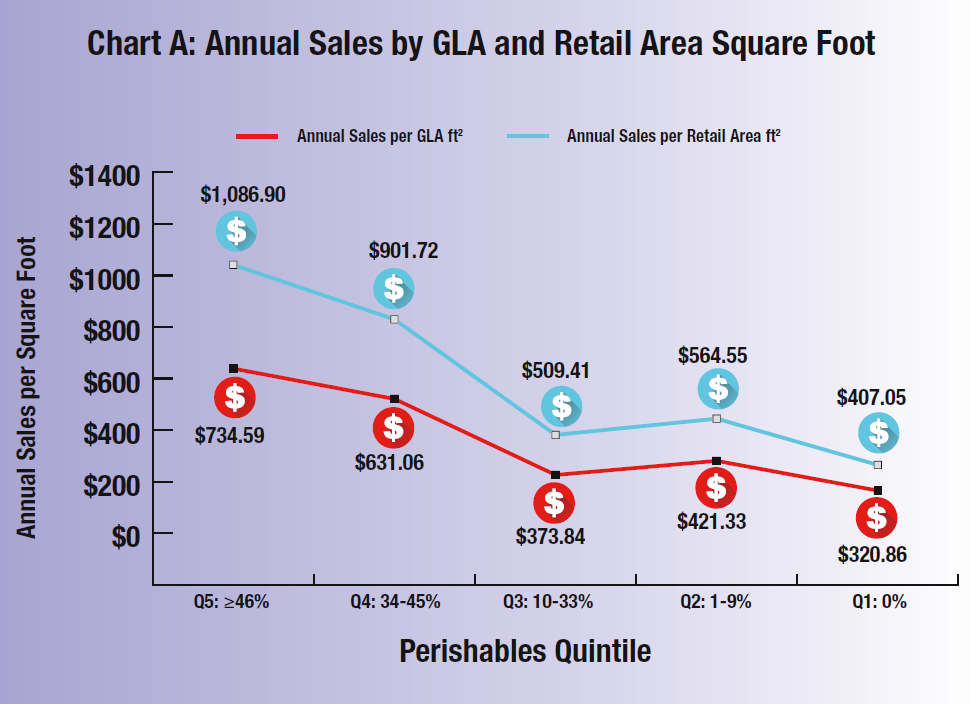
Sales per ft2, the universal yardstick of retail store productivity, followed the bifurcated world we have been reporting throughout the entire survey: stores that sell lots of fresh food enjoy higher sales per ft2, ranging from $631.06 to $734.59 per GLA annually, and $901.72 to $1,086.90 per retail area. Supplement-oriented stores reported sales per ft2 of $320.86 to $421.33 per GLA annually, and $407.05 to $564.55 per retail area. Overall, for all stores in the survey, sales per ft2 were $628.76 per GLA annually, and $888.12 per retail area, up from $616 and $814, respectively, in last year’s survey (see Chart A).
Piece of the PieWe asked survey respondents to discuss their most pressing problems, and many were willing to share their concerns.
Natural is moving into town, say some respondents, many of whom are wondering how long they can hold out. Some aren’t happy about the products in their stores being more readily available in mainstream outlets; and some retailers blame manufacturers for letting that happen. Others believe more out-of-stocks are due to the increased demand from mainstream stores.
Several respondents told us they feel manufacturers and distributors are favoring big box stores and Amazon by giving them steep discounts, lowering retail prices for shoppers. And many feel this is a stab in the back to the independents. One retailer griped about manufacturers that sell direct to consumers on marketplaces like Amazon while prohibiting others from doing the same.

Another accused some brands of not dedicating enough resources to enforcing their well-advertised MAP policies, which destroys the retail price point, they said.
Other retailers feel that the problem of big box stores coming to town isn’t just competing on price; it’s competing against poor quality products. Shoppers can’t always differentiate and therefore don’t understand the higher prices at independent stores. Also, if a poor-quality product makes the headlines as a “bad actor,” they sometimes feel negative connotations reflect on their stores.
Several respondents are turning to online retailing to try to compete, with some planning to add an online store. One retailer reported competing with online sales by offering a delivery service. With Amazon cited as a huge competitor, retailers across the board are reporting that competing with online prices is very difficult. One noted that even if they do open an online store, they cannot compete on price. Their strategy? Offer more specialized, harder-to-find options.
Similarly, one family-owned brick and mortar store said that selling customized products has helped keep the business afloat amidst a sea of competition. Several are bringing in more fresh foods, like a deli, to woo daily shoppers.
A common challenge for storekeepers is finding good staff that are qualified and willing to work. Team members also need to deal with customers fishing for information, then searching for a better price online while standing in the store! It’s enough to make some lose faith in humanity.
Nevertheless, quite a few respondents expressed the strong belief that it remains critically important to consistently provide knowledgeable, friendly customer service to build friendships, community and customer loyalty.
From small stores to large ones, from newbies to veterans, it’s clear that challenges lie ahead for independent natural products retailers. But it’s also clear that more and more shoppers desire natural products, and that a whole new generation is embracing the values of locally owned, independent businesses. Perhaps especially, independent natural products retailers.WF
Sponsored by Action Brand Management
 Notes on the 2017 Retail Insights Universe For Natural and Organic Sales
Square Footage up 4.2 Percent; Sales up 3.8 percent
By Jay Jacobowitz, President and Founder, Retail Insights®
Notes on the 2017 Retail Insights Universe For Natural and Organic Sales
Square Footage up 4.2 Percent; Sales up 3.8 percent
By Jay Jacobowitz, President and Founder, Retail Insights®
Total natural organic sales climbed $2.78 billion in 2016, or 3.8 percent, to $75.2 billion from $72.4 billion, and now account for 11.56 percent of total food store sales of $650.5 billion. The average store sells $670,210 in natural products per year, up 3.3 percent from $648,574 a year ago, and the average gross-lease-area dedicated to natural products is also up 3.7 percent, to 1,173 square feet, from 1,131 last year. Average annual sales per square foot is nearly identical, at $572 this year compared to $573 last year.
Channel AnalysisGrowth in the club store channel was subdued, with these large stores adding 2 percent to their natural square footage and gaining 1.7 in net sales, to $4.58 billion from $4.51 billion a year ago.For the compact grocer sector—stores of 20,000 square feet or less—Mrs. Greens suffered two cycles of store closings since the last analysis; currently operating just five units, down from 18 units, and a reduction in total estimated net sales of more than $50 million. Also in the compact grocer sector, Natural Grocers by Vitamin Cottage (NGVC) grew store units 25 percent, to 126 in 2016 from 101 in 2015. These younger stores led to a decline in NGVC’s average store productivity, to approximately $5.6 million per unit in 2016 compared to nearly $6.0 million last year. Rounding out the compact grocers, Trader Joe’s added 12 stores, to total 460 from 448. Overall, the compact grocer sector gained 3.3 percent in sales, to $11.06 billion from $10.7 a year ago.
For independent natural retailers and coops, a certain level of store rationalization is taking place, with a loss of 148 units, or 2.2 percent, to 6,574 stores from 6,722 stores a year ago. The surviving stores are vibrant and in growth mode, adding 6.2 percent to net sales, and averaging $1,676,766 per store compared to $1,578,875 in 2015. Average store size also increased, to 3,563 square feet per store from 3,470 a year ago. Overall, the independent channel gained 3.9 percent in net sales, to $11,023,057,429 from $10,613,200,326.
Mass merchandisers were the picture of stability, adding about 1 percent in number of units and square footage, with natural sales climbing 1.4 percent to $4.89 billion from $4.82 billion last year.
Overall, pharmacies including independents, chain stores, and in supermarkets, shed 67 stores, to 60,134 from 60,201 last year. Sales slipped 0.4 percent to $3.85 billion. For conventional supermarkets, average natural square footage per store increased 2.5 percent. The sector saw an increase in total natural sales of 4.2 percent. This is notable given the pervasive reporting of food price deflation, particularly in the fresh protein categories including dairy, beef, pork and poultry, although the natural sector may not have seen as much protein deflation.
Supernaturals are showing signs of overheating, with store counts up 7 percent, square footage up 13 percent, but total sales climbing just 5.5 percent. As a result, sector sales productivity has taken a hit, declining 6.5 percent, to $766 per square foot per year, from $819 a year ago.
Vitamin chain stores are showing discipline, growing units 3.8 percent and keeping total square footage in line with a 3.3 percent increase. Shoppers rewarded the sector, raising sales 5 percent. JJ
TABLES:
 Published in WholeFoods Magazine January 2017